- Quant (QNT) has been trading on a bullish sentiment for the past week.
- Bulls are aiming to breach the strongest QNT resistance at $149.
- QNT has inclined by 2.06% in the past 24 hours.
Today’s market trades are positive, and QUANT (QNT) is no exception. According to the cryptocurrency market monitoring website CoinMarketCap, QNT is currently trading at $142.19, up 2.06% in the last day. The coin has gained more than 17% over the past week and is still in the bullish momentum.
Over the past day, Quant was able to gain ground versus the two most famous cryptocurrencies on the market, Bitcoin (BTC) i Etereum (ETH), by around 1.03% and 0.60%, respectively. Quant’s market cap, which has increased by more than 1.60% to $1,714,161,362, is also another sign that QNT is in the positive territory. It is the 32nd largest cryptocurrency, according to market cap.
The QNT price was successfully maintained in a range between $141 and $139 thanks to the bullish surge. Investors may expect the QNT price to move above its current resistance mark at $149 if the upward trend continues.

The beginning of a bullish rally toward the next resistance level, which is approximately $153, will be indicated by a break above the $149 barrier level. Investors should prepare for a further decline toward the $126 level if the bulls’ run comes to an end and the QNT price breaks through its support level of $131. This might have severe long-term effects for QNT pricing.
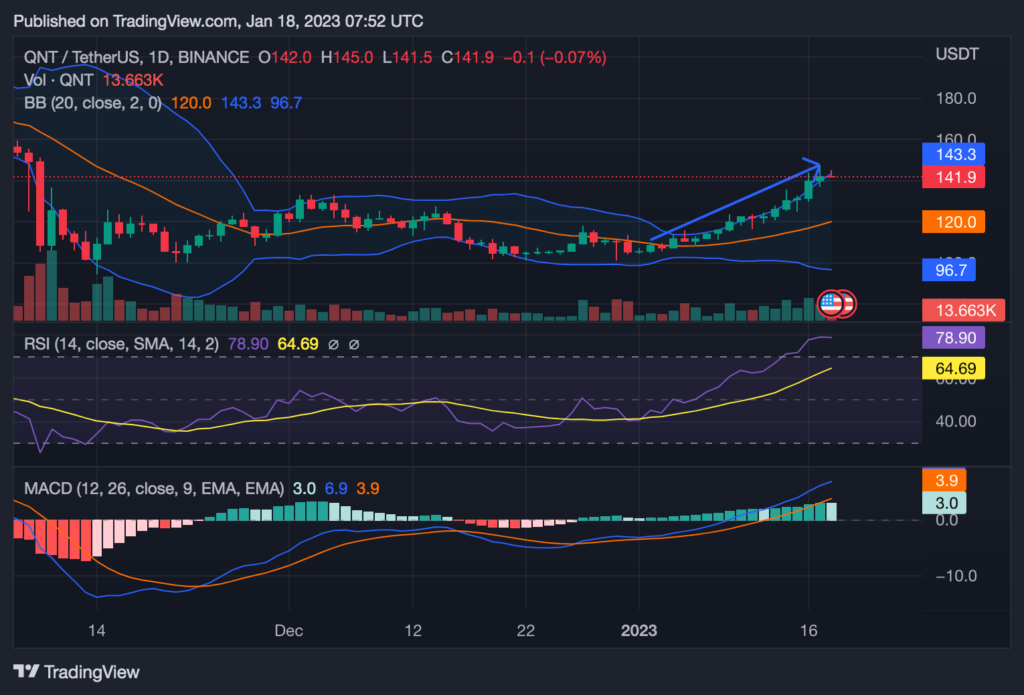
The price of QNT is moving in the direction of its biggest resistance level, which is $149. This comes after the price of Quant started moving upward over the previous 7 to 14 days consequently. QNT’s price was able to break above the 9-week EMA line as a result, and it is currently attempting to do the same with the 20-week EMA line.
Additionally, the relative strength index (RSI) is in the overbought zone at the moment, at 78.90, indicating that the price may consolidate at the current level before breaking out. The RSI score also indicates strong purchasing pressure, demonstrating that buyers control the QNT market. The MACD line (blue) moving above the signal line(orange) on a daily basis indicates that the bullish momentum is gaining strength.
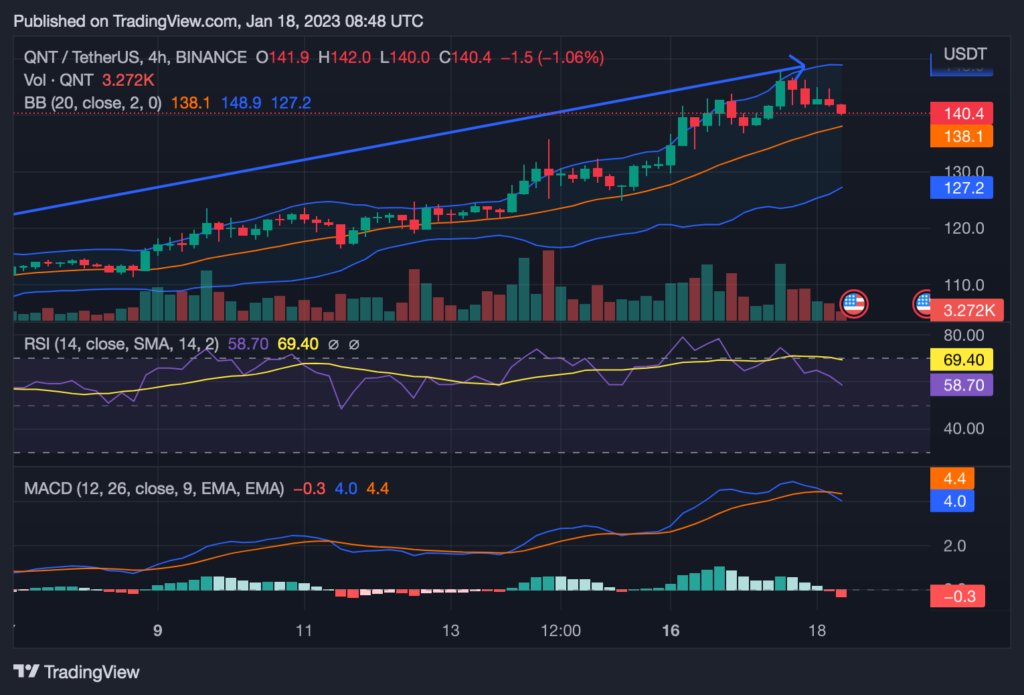
The QNT 4-hour price chart reveals that the market has been dominated by bulls, with a consistent uptrend. The bulls are pushing prices higher despite a few little bear bites. The market is neither oversold nor overbought at the moment because the RSI is at 58.70, indicating that the bulls might soon pause and give the bears a chance to gain some ground.
odricanje: Stavovi i mišljenja, kao i sve informacije iznesene u ovoj analizi cijena, objavljuju se u dobroj namjeri. Čitaoci moraju sami da istraže i provjere dužnu pažnju. Svaka radnja koju poduzima čitatelj je striktno na vlastitu odgovornost, Coin Edition i njegove podružnice neće biti odgovorni za bilo kakvu direktnu ili indirektnu štetu ili gubitak
Source: https://coinedition.com/bulls-strong-momentum-aims-to-push-qnt-to-149-crucial-resistance/