In the daily bar chart of ADBE, below, we can see that prices fell sharply in recent days to make a new low for the move down. Weakness in the broader market averages probably contributed. Prices are trading below the declining 50-day moving average line again after rallying above it earlier in June.
The On-Balance-Volume (OBV) line has made a new low for its move lower and tells us that sellers of ADBE remain more aggressive than buyers. The Moving Average Convergence Divergence (MACD) oscillator is now back below the zero line for a repeat sell signal.

In the weekly Japanese candlestick chart of ADBE, below, we can see a doji followed by a long red (bearish) candle for a bearish engulfing pattern to mark a top reversal. This reversal is followed by another doji. This doji will probably not get bullish confirmation this week (we’ll see) so we cannot count on another reversal. The 40-week moving average line is bearish.
The OBV line remains weak and the MACD oscillator is struggling to cross to the upside.
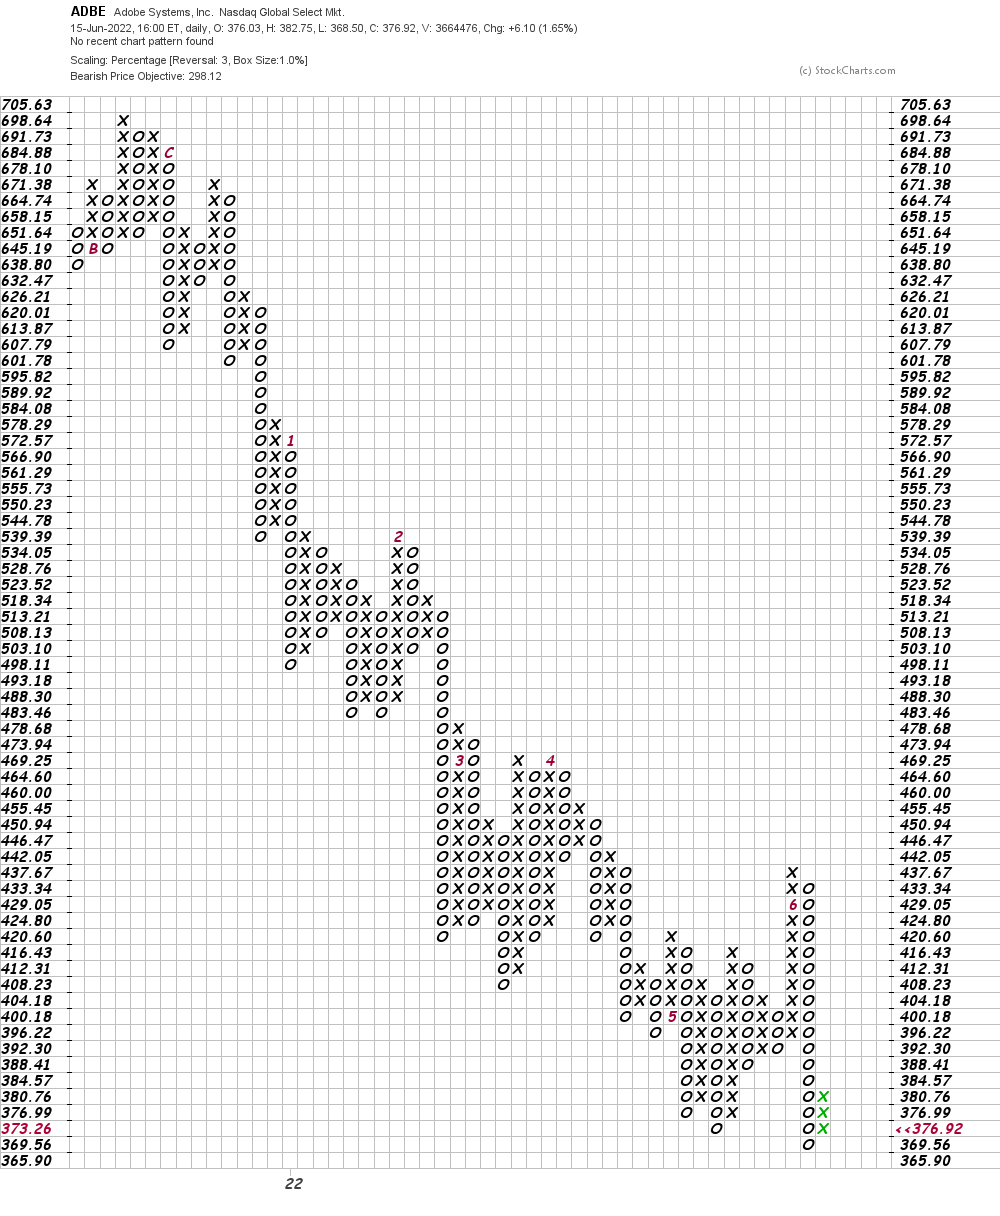
In this daily Point and Figure chart of ADBE, below, we can see a downside price target in the $298 area.
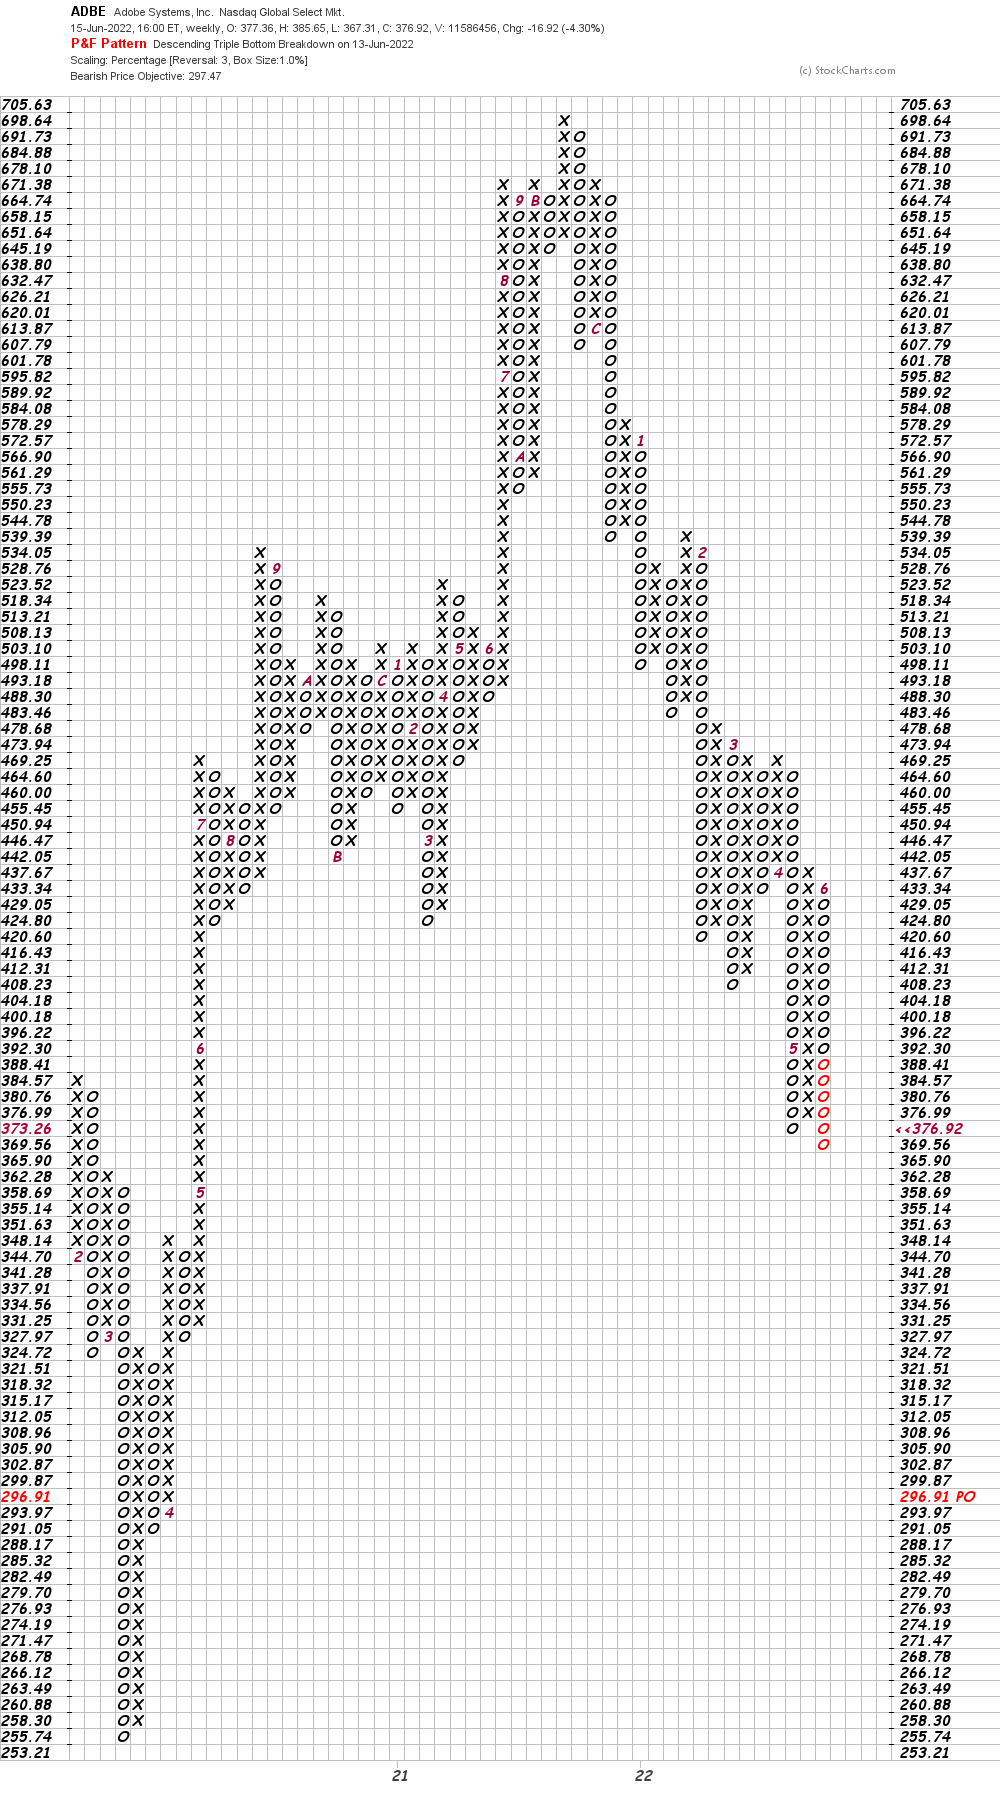
In this weekly Point and Figure chart of ADBE, below, we can see the same price target as the daily chart — $298.
Bot-line strategija: Weakness in the broader market averages is no friend of the charts of ADBE. I have no special knowledge of what ADBE will report to shareholders and analysts Thursday night but the risk is for further declines. Avoid the long side of ADBE.
Primi upozorenje e-poštom svaki put kad napišem članak za Real Money. Kliknite "+ Prati" pored mog uputstva za ovaj članak.
Source: https://realmoney.thestreet.com/investing/stocks/looking-at-the-charts-of-adobe-ahead-of-earnings-16029245?puc=yahoo&cm_ven=YAHOO&yptr=yahoo