Negative sentiment has dominated the market this week as Ethereum failed to reclaim the $2000 level. The bears are attempting to pull the price back below the breakout level and trap the bulls.
Tehnička analiza
by: sivkast
Dnevni grafikon
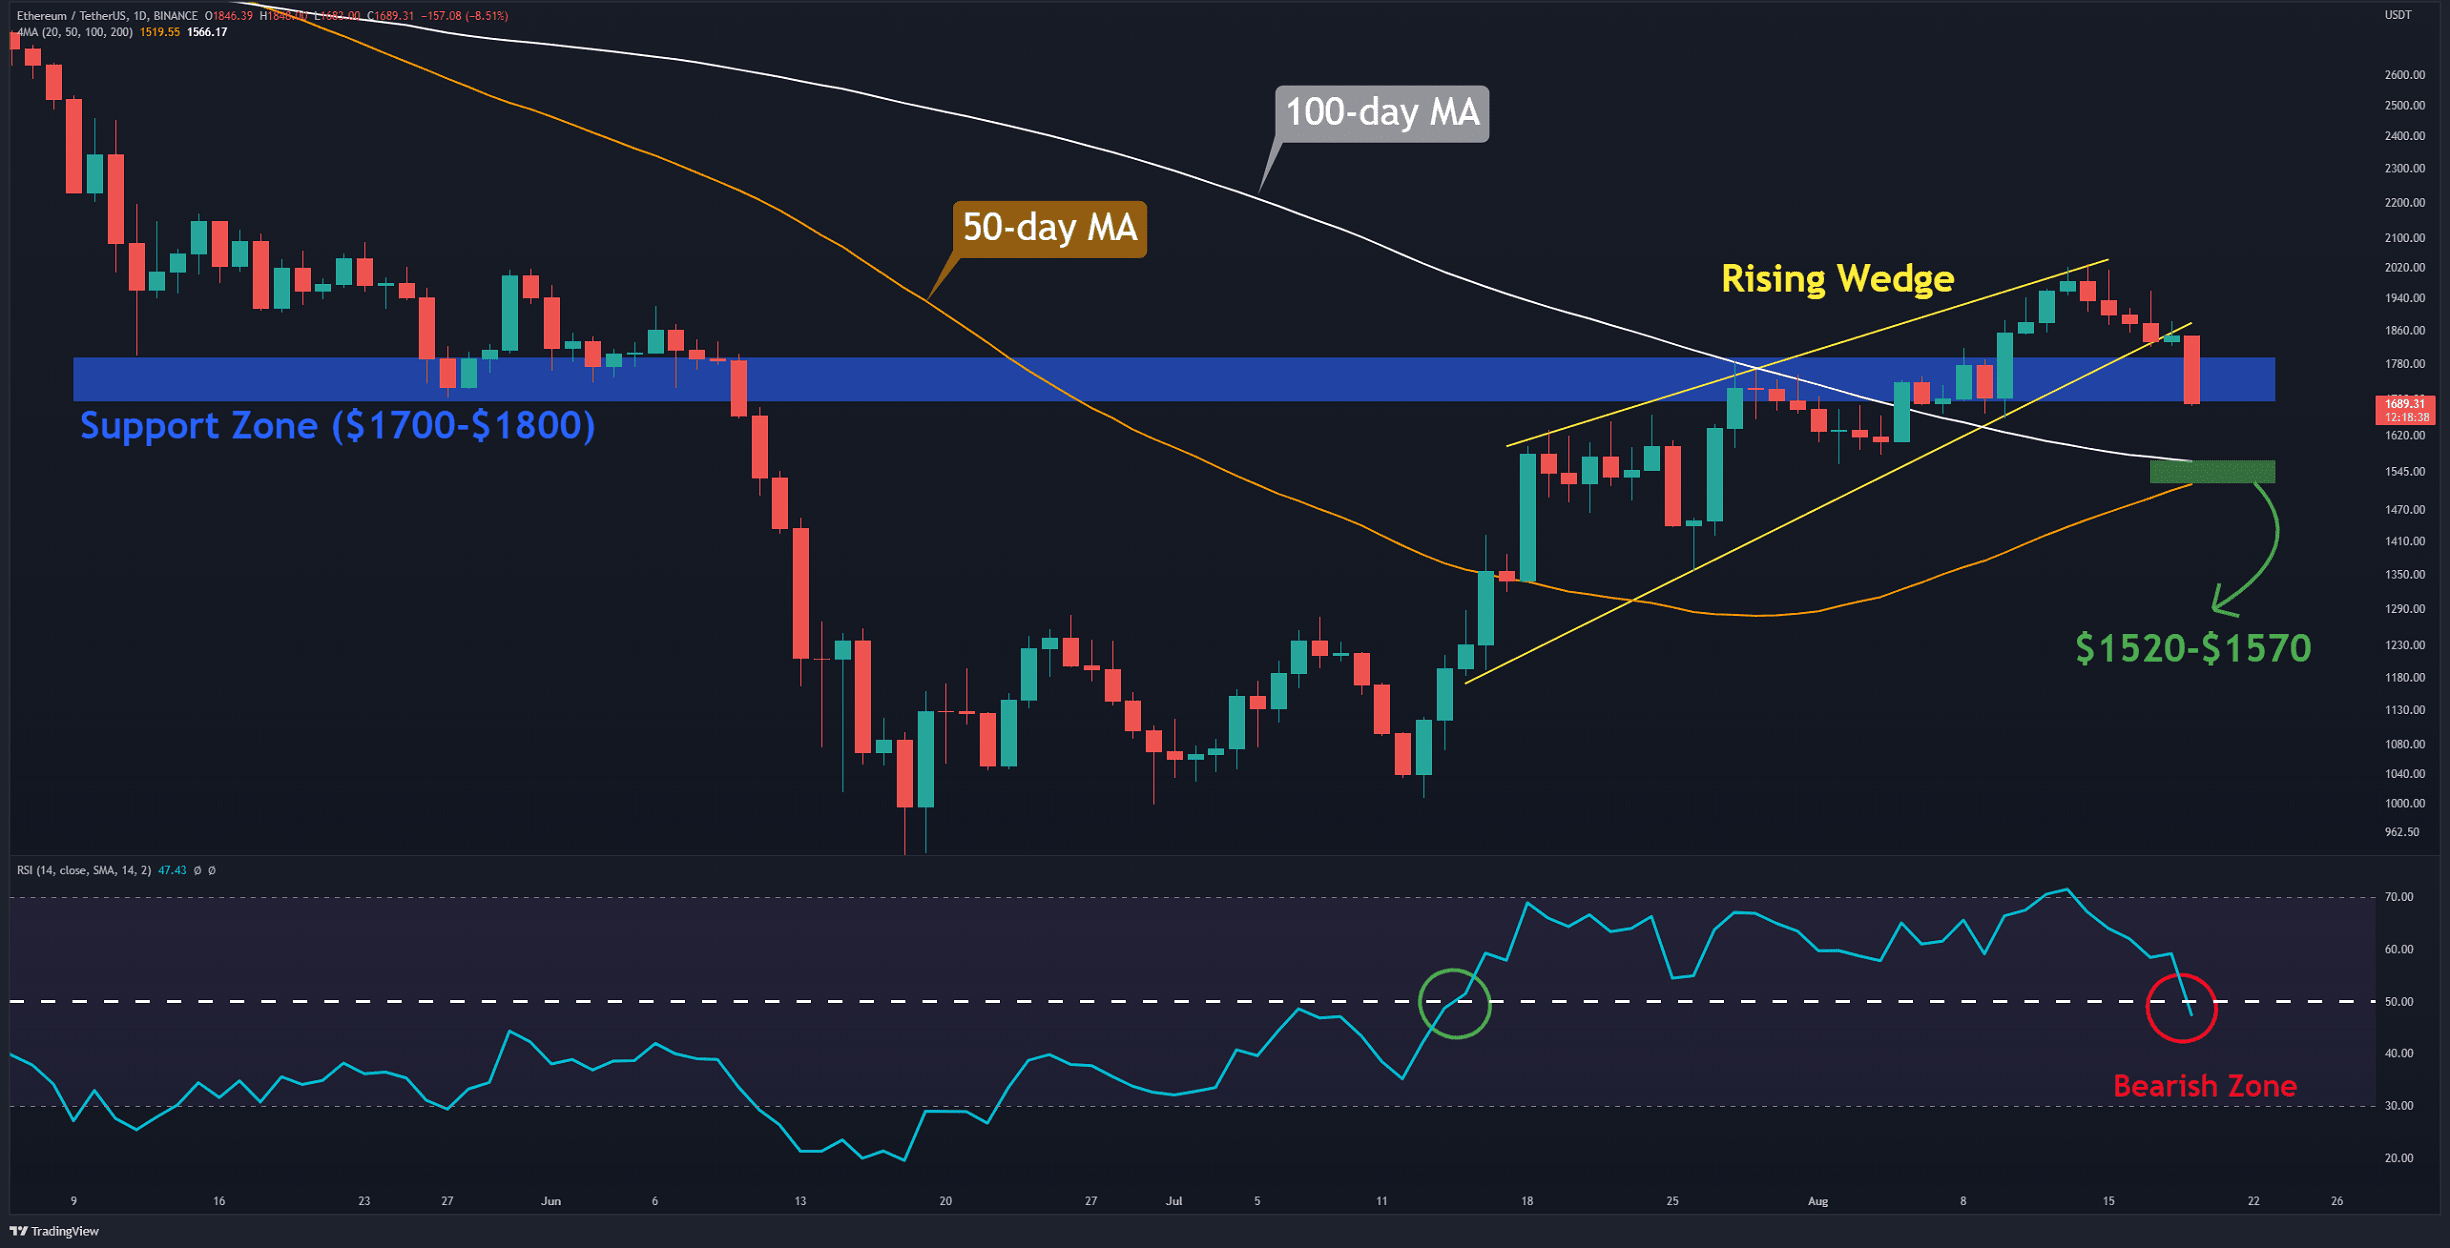
The bears stepped in to induce a 16% decline over the past six days after Ethereum was rejected from $2,000. Consequently, the appearance of the rising wedge pattern (in yellow) could be a signal that the bearish trend might extend. The bulls must prevent a decline below the critical level in the $1,700-$1,800 range.
The Relative Strength Index (RSI) indicator has also slipped below the baseline, which suggests that the bears dominate the momentum.
If the pair continues to decline, the closest support will be found in the range of $1520-$1570 (in green). This support is the result of the intersaction between the 50-day moving average line(in orange) and the 100-day (in white) moving average line. If this level cracks, the possibility of forming a bear structure would be strengthened, thereby sending Ethereum to test $1,280. The bulls have no choice but to hold the price above $1,700 to resume the bullish trend.

Ključni nivoi podrške: 1700 USD i 1500 USD
Ključni nivoi otpora: 2000 USD i 2200 USD
Dnevni pokretni prosjeci:
MA20: 1777 dolara
MA50: 1519 dolara
MA100: 156 dolara
MA200: 2237 dolara
ETH/BTC grafikon
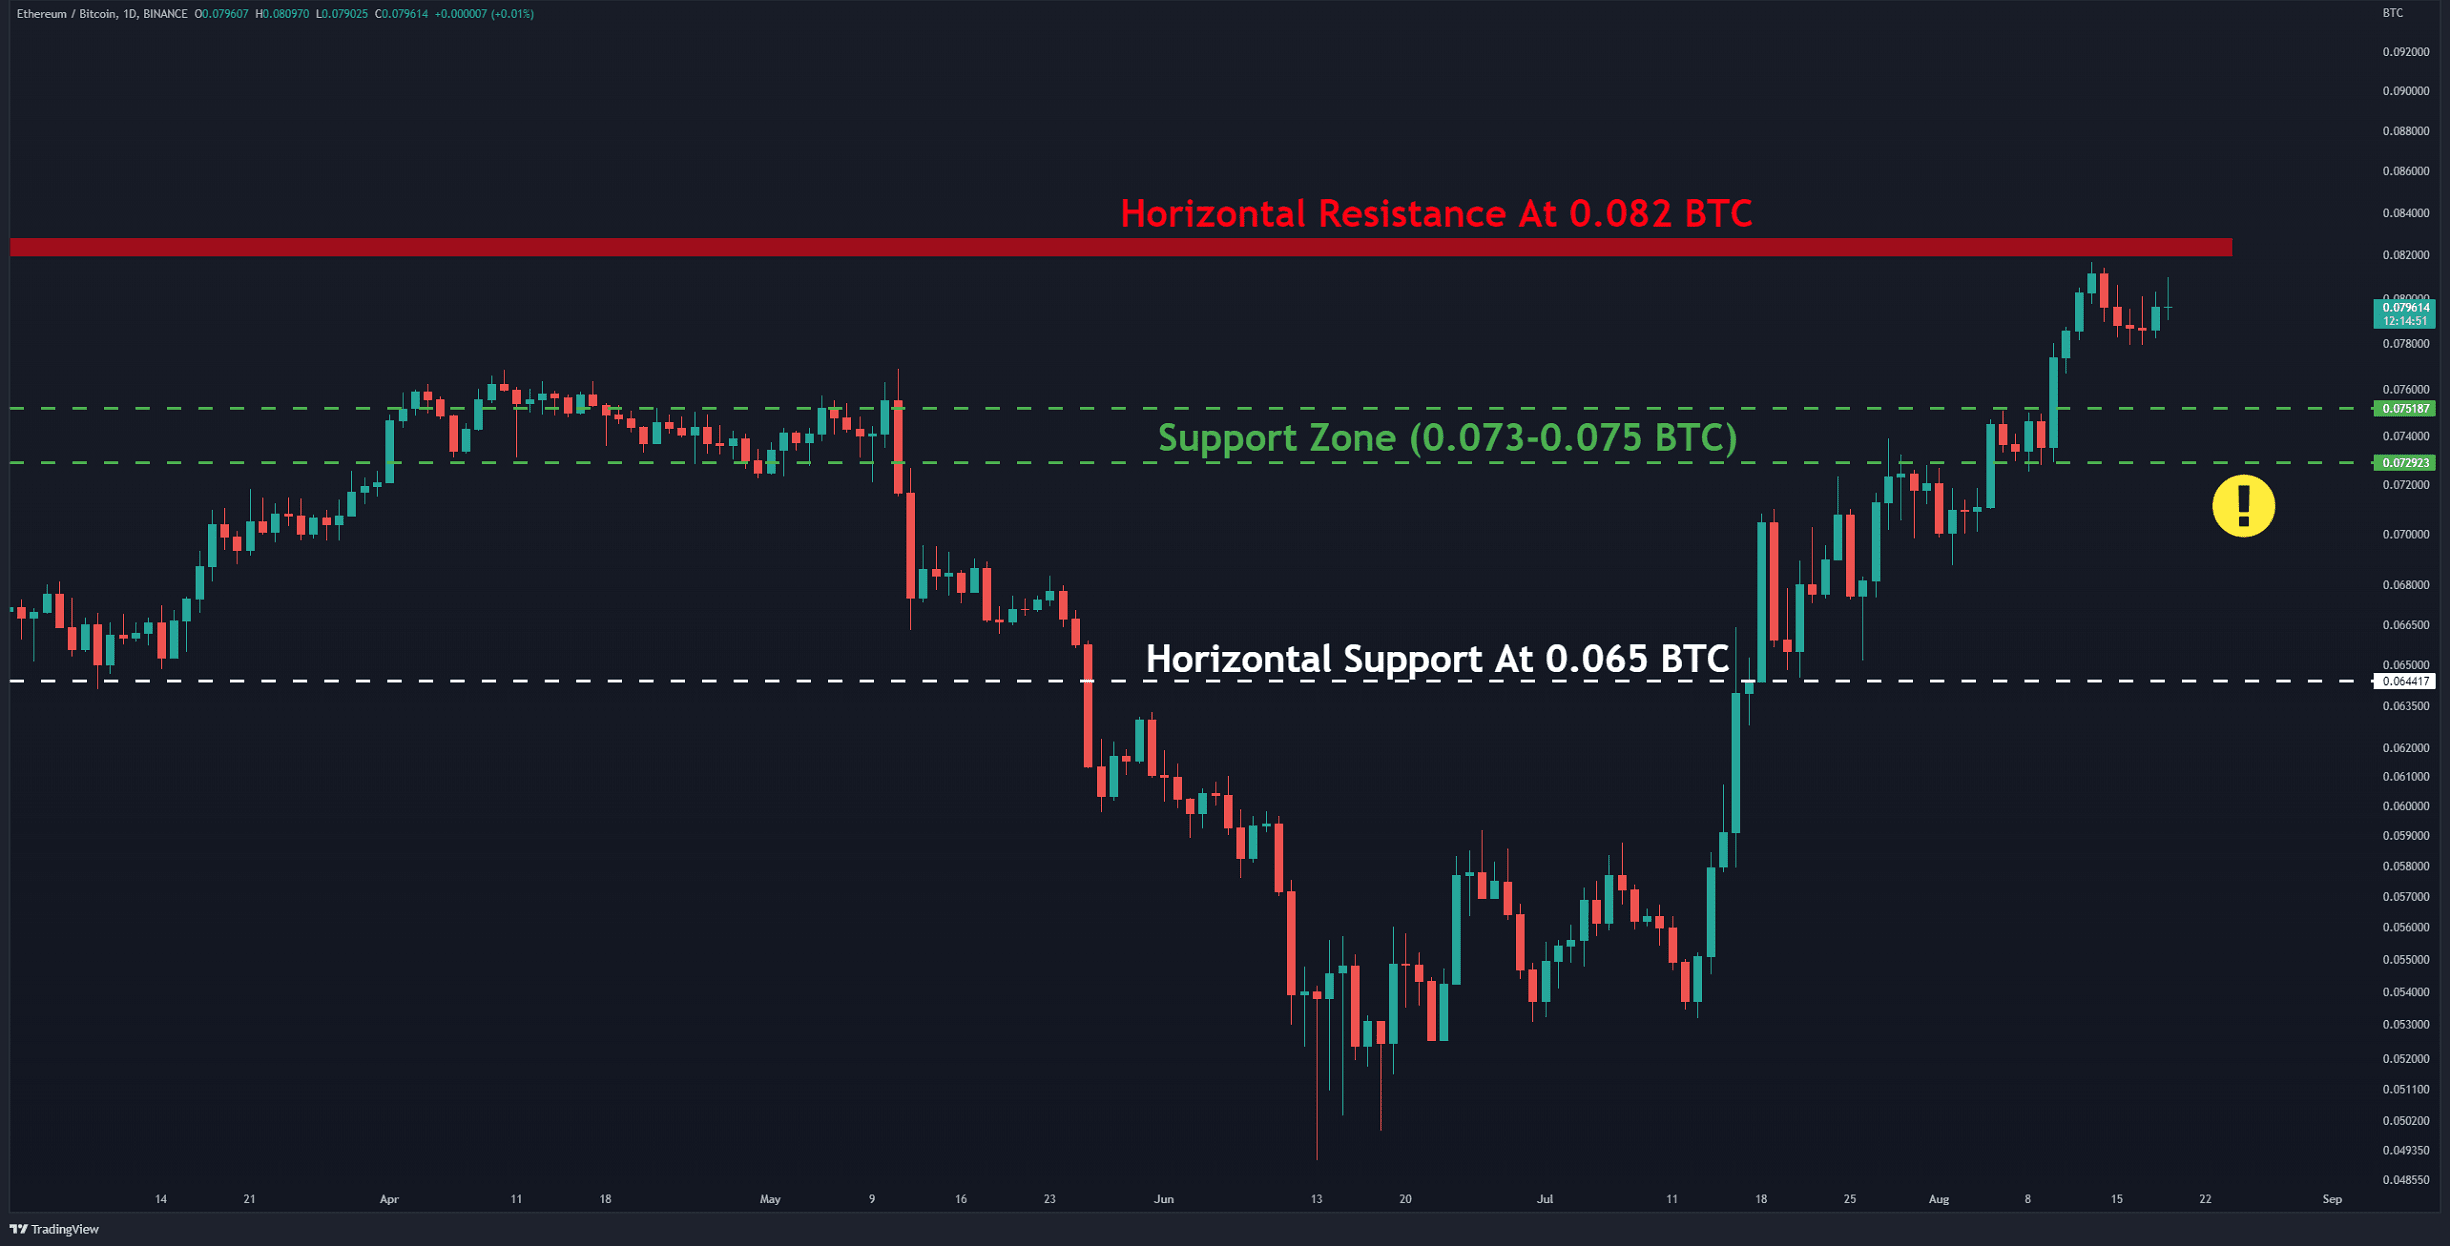
Against Bitcoin, the situation is slightly different. Although the bulls failed to push the price above the horizontal resistance at 0.082 BTC (in red), they still control the market. A break and close below the support zone at 0.073-0.075 BTC (in green) would signal the start of a bearish rally with a target of approximately 0.065 BTC (in white).
Ključni nivoi podrške: 0.0.75 & 0.065 BTC
Ključni nivoi otpora: 0.082 & 0.088 BTC
Analiza osjećaja
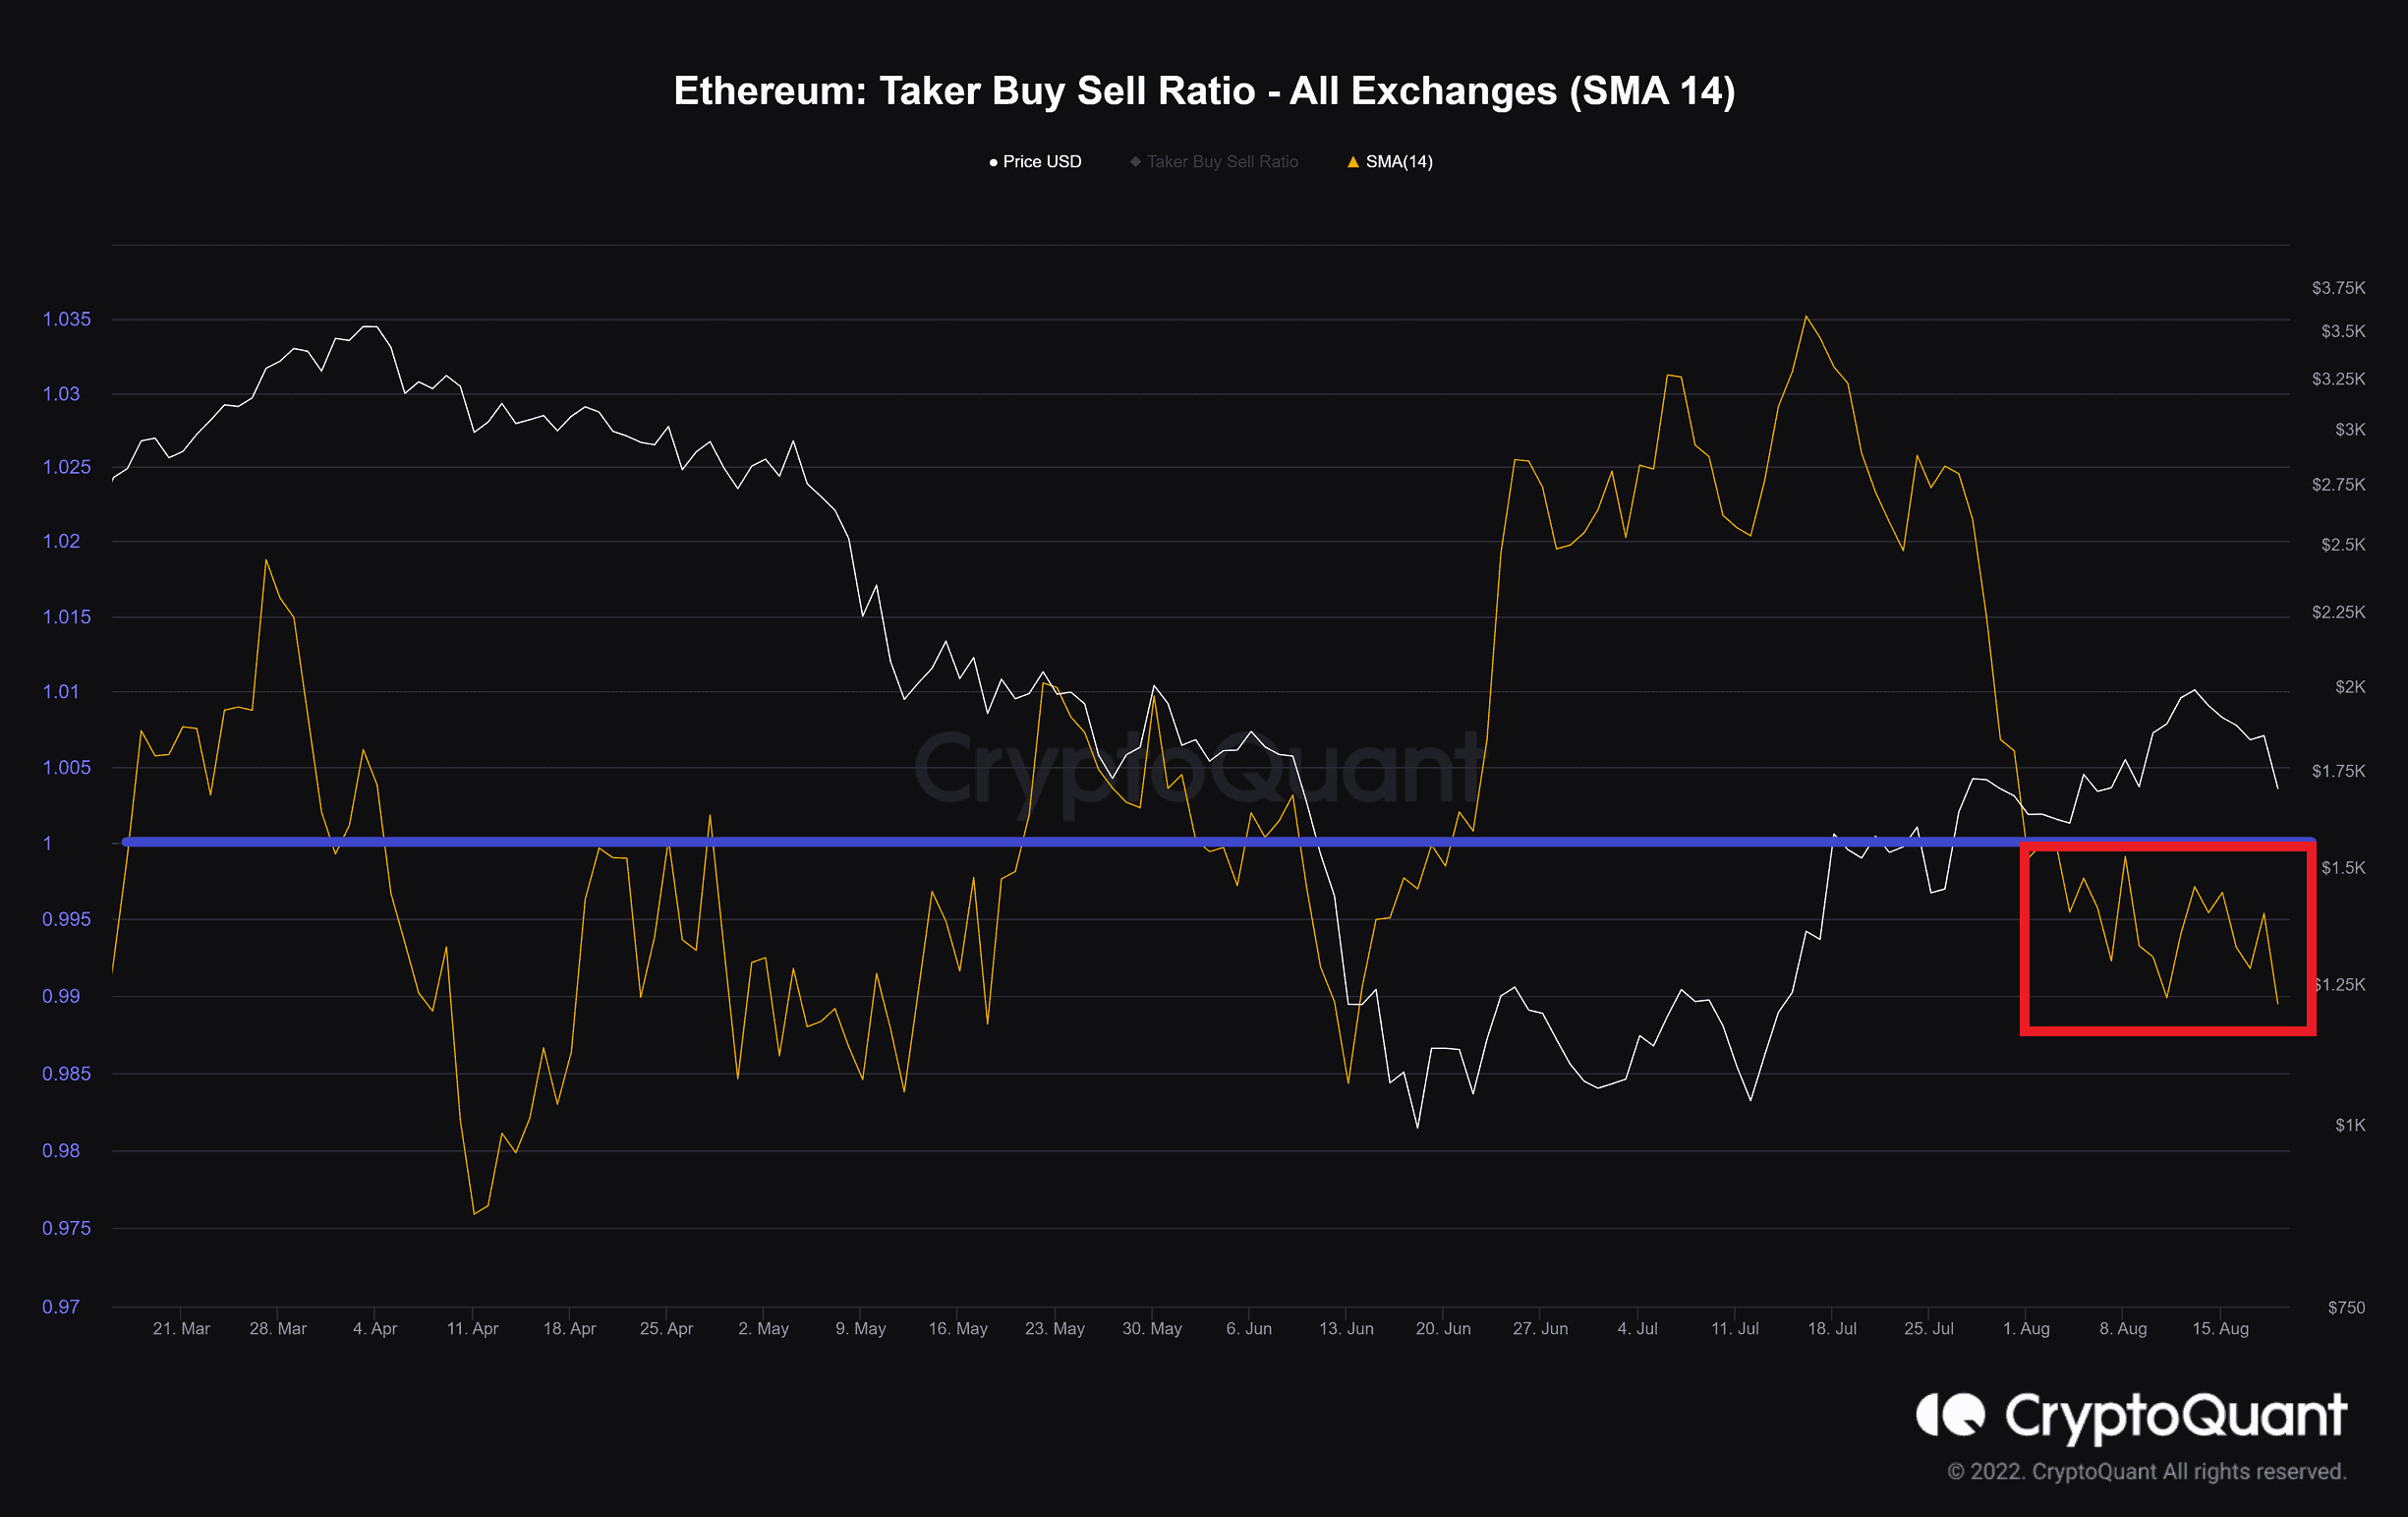
Taker Buy Sell Ratio (SMA14)
Definicija: The ratio of buying volume divided by selling volume of takers in perpetual swap trades.
Values over 1 indicate that the bullish sentiment is dominant.
Values under 1 indicate that the bearish sentiment is dominant.
As mentioned in our previous analysis, some investors preferred to book their profits when the price reached the technical resistance levels. Also, more sell orders have been filled by takers in the derivative market, which shows that the bearish sentiment prevails. As a result, the metric drops below line 1 (in blue). As long as this metric does not return above it, the chances of a considerable recovery remain slim.
Binance besplatno $100 (ekskluzivno): Koristite ovu vezu da se registrujete i dobijete 100 $ besplatno i 10% popusta na Binance Futures prvi mjesec (uslovi).
PrimeXBT posebna ponuda: Koristite ovu vezu da se registrujete i unesete POTATO50 kod da dobijete do $7,000 na svoje depozite.
Izjava o odricanju odgovornosti: Podaci koji se nalaze na CryptoPotatu su podaci pisaca. Ne predstavlja mišljenja CryptoPotata o tome da li kupiti, prodati ili zadržati bilo kakva ulaganja. Savjetujemo vam da prije donošenja bilo kakvih odluka o investiranju provedete vlastita istraživanja. Korištene informacije koristite na vlastiti rizik. Pogledajte odricanje za dodatne informacije.
Cryptocurrency karte od TradingView.
Source: https://cryptopotato.com/ethereum-crashes-9-in-a-day-wheres-the-next-support-eth-price-analysis/