
Prethodno on-chain istraživanje sugeriralo je da je dno tržišta Bitcoin-a unutra. CryptoSlate preispitao nekoliko Glassnode metrika, koje i dalje ukazuju na dno cijene.
Međutim, makro faktori, koji možda nisu bili prisutni u prethodnim ciklusima, ostaju u igri, potencijalno utičući na tekući ciklus.
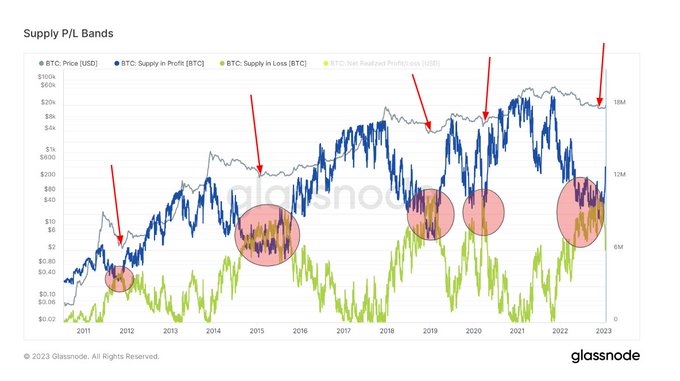
Bitcoin Supply P/L Bands
Opseg P/L ponude Bitcoin pokazuje opticajnu ponudu koja je ili u dobiti ili gubitku, na osnovu cijene tokena koja je viša ili niža od trenutne cijene u vrijeme posljednjeg kretanja.
Dno tržišnog ciklusa poklapa se sa konvergiranjem linija ponude u dobiti (SP) i ponude u gubitku (SL), što se dogodilo nedavno oko četvrtog kvartala 4. Naknadni čin razilaženja linija korespondirao je sa preokretima cijena u prošlosti.
Trenutno, SP opseg je naglo porastao kako bi se odvojio od SL opsega, što sugerira da bi makro rast cijene mogao biti na kartama ako se obrazac zadrži.
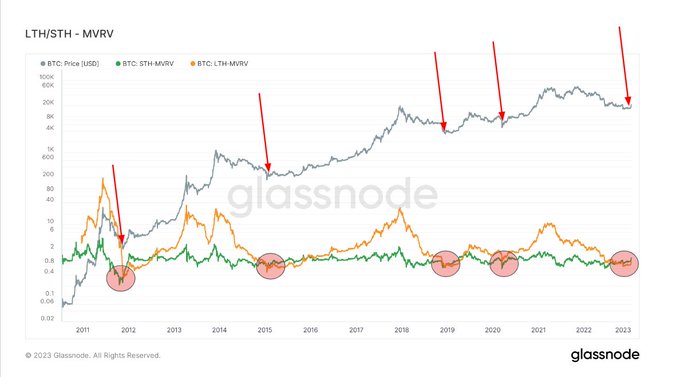
Tržišna vrijednost prema ostvarenoj vrijednosti
Tržišna vrijednost prema ostvarenoj vrijednosti (MVRV) odnosi se na omjer između tržišne kapitalizacije (ili tržišne vrijednosti) i ostvarene vrijednosti (ili pohranjene vrijednosti). Upoređujući ove informacije, MVRV pokazuje kada se cijena Bitcoina trguje iznad ili ispod „fer vrijednosti“.
MVRV je dalje podijeljen na dugoročne i kratkoročne imaoce, pri čemu se MVRV dugoročnog držača (LTH-MVRV) odnosi na nepotrošene transakcije sa životnim vijekom od najmanje 155 dana, a MVRV kratkoročnog držača (STH-MVRV) jednak na nepotrošene transakcije životni vijek od 154 dana i manje.
Previous cycle bottoms featured a convergence of the STH-MVRV and LTH-MVRV lines, with the former crossing above the latter to signal a bullish reversal in price.
During Q4 2022, a convergence between the STH-MVRV and LTH-MVRV lines occurred. And, within recent weeks, the STH-MVRV has crossed above the LTH-MVRV, signaling the possibility of a price trend reversal.
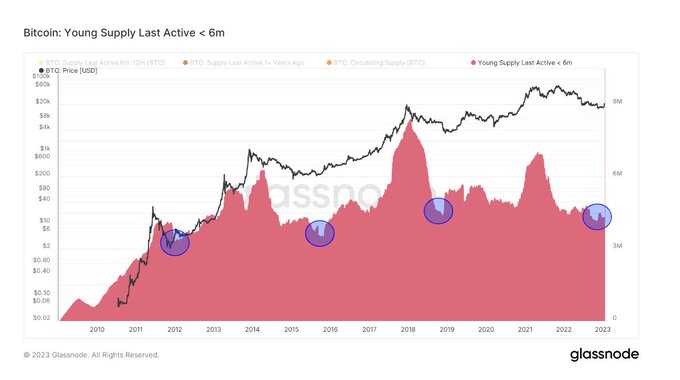
Young Supply Last Active < 6m & Holders in Profit
Young Supply Last Active <6m (YSLA<6) refers to Bitcoin tokens that have transacted within the last six months. The opposing scenario would be long-term holders sitting on their tokens and not actively participating in the Bitcoin ecosystem.
At bear market bottoms, YSLA<6 tokens account for less than 15% of the circulating supply as non-believers/hit-and-run speculators leave the market during the cycle of depressed prices.
The chart below shows YSLA<6 tokens reached the “less than 15% threshold” late last year, suggesting a capitulation of speculative interest.
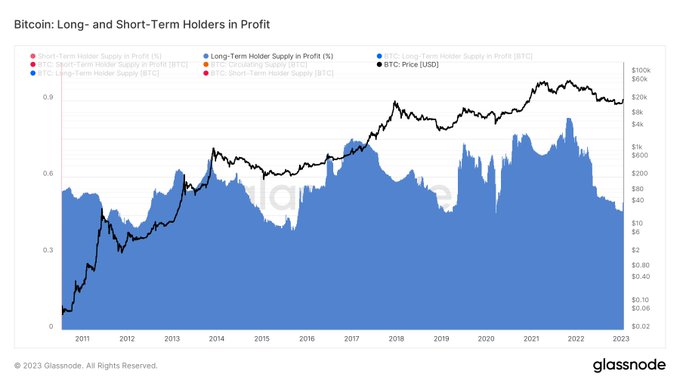
Similarly, the chart below shows Long-Term Holders in Profit currently close to All-Time Lows (ATLs.) This corroborates that long-term holders hold most of the supply and remain unfazed by the -75% price drawdown from the market top.
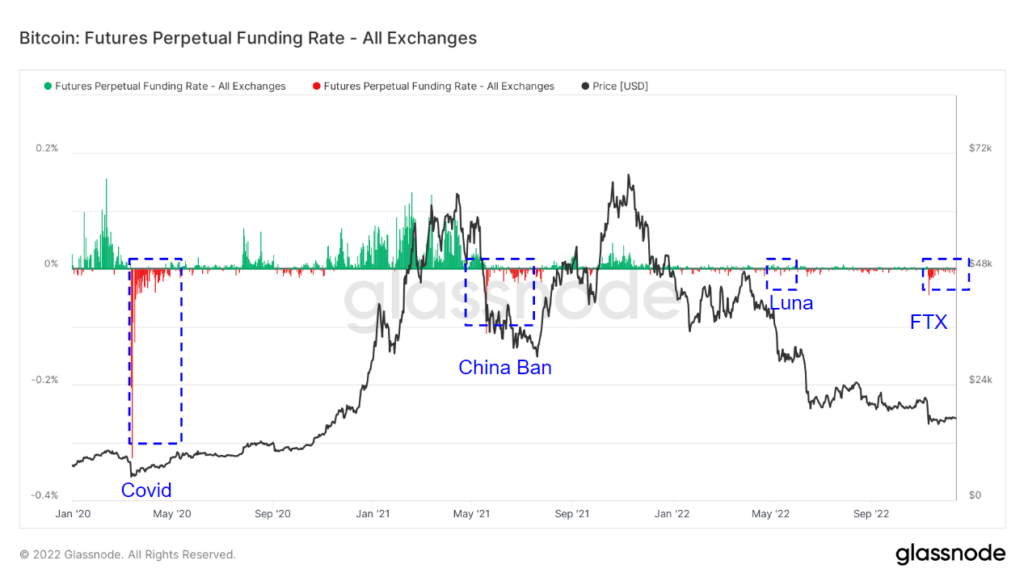
Stopa trajnog finansiranja fjučersa
Stopa trajnog finansiranja u budućnosti (FPFR) se odnosi na periodična plaćanja koja se vrše trgovcima derivatima ili od strane trgovaca derivatima, i duga i kratka, na osnovu razlike između tržišta sa stalnim ugovorom i spot cijene.
During periods when the funding rate is positive, the price of the perpetual contract is higher than the marked price. In this instance, long traders pay for short positions. In contrast, a negative funding rate shows perpetual contracts are priced below the marked price, and short traders pay for longs.
This mechanism keeps futures contract prices in line with the spot price. The FPFR can be used to gauge traders’ sentiment in that a willingness to pay a positive rate suggests bullish conviction and vice versa.
The chart below shows periods of negative FPFR, especially during black swan events, which were typically followed by a price reversal. The exception was the Terra Luna de-peg, likely because it triggered a string of centralized platform bankruptcies, therefore acting as a headwind against positive market sentiment.
From 2022 onwards, the magnitude of the funding rate, both positive and negative, has significantly reduced. This would suggest less conviction in either direction compared to pre-2022.
Following the FTX scandal, the FPFR has been primarily negative, indicating general market bearishness and the possibility of price bottoming. Interestingly, the FTX scandal triggered the most extreme move in the funding rate since before 2022.
Source: https://cryptoslate.com/research-on-chain-metrics-continue-signaling-a-bitcoin-bottom/