Bitcoin’s price has been in a free-fall during the past few days after it broke below the $30K support level. It’s now found close to the critical point at $20K, so it’s important to see what will be the immediate lifeline if it fails.
Tehnička analiza
By Edris
Dnevni grafikon
The price has also broken the $24K demand zone to the downside and is heading towards the significant $17K-$20K area with massive momentum. This level could finally hold the price, as the RSI also signals that Bitcoin is highly oversold (below 30).
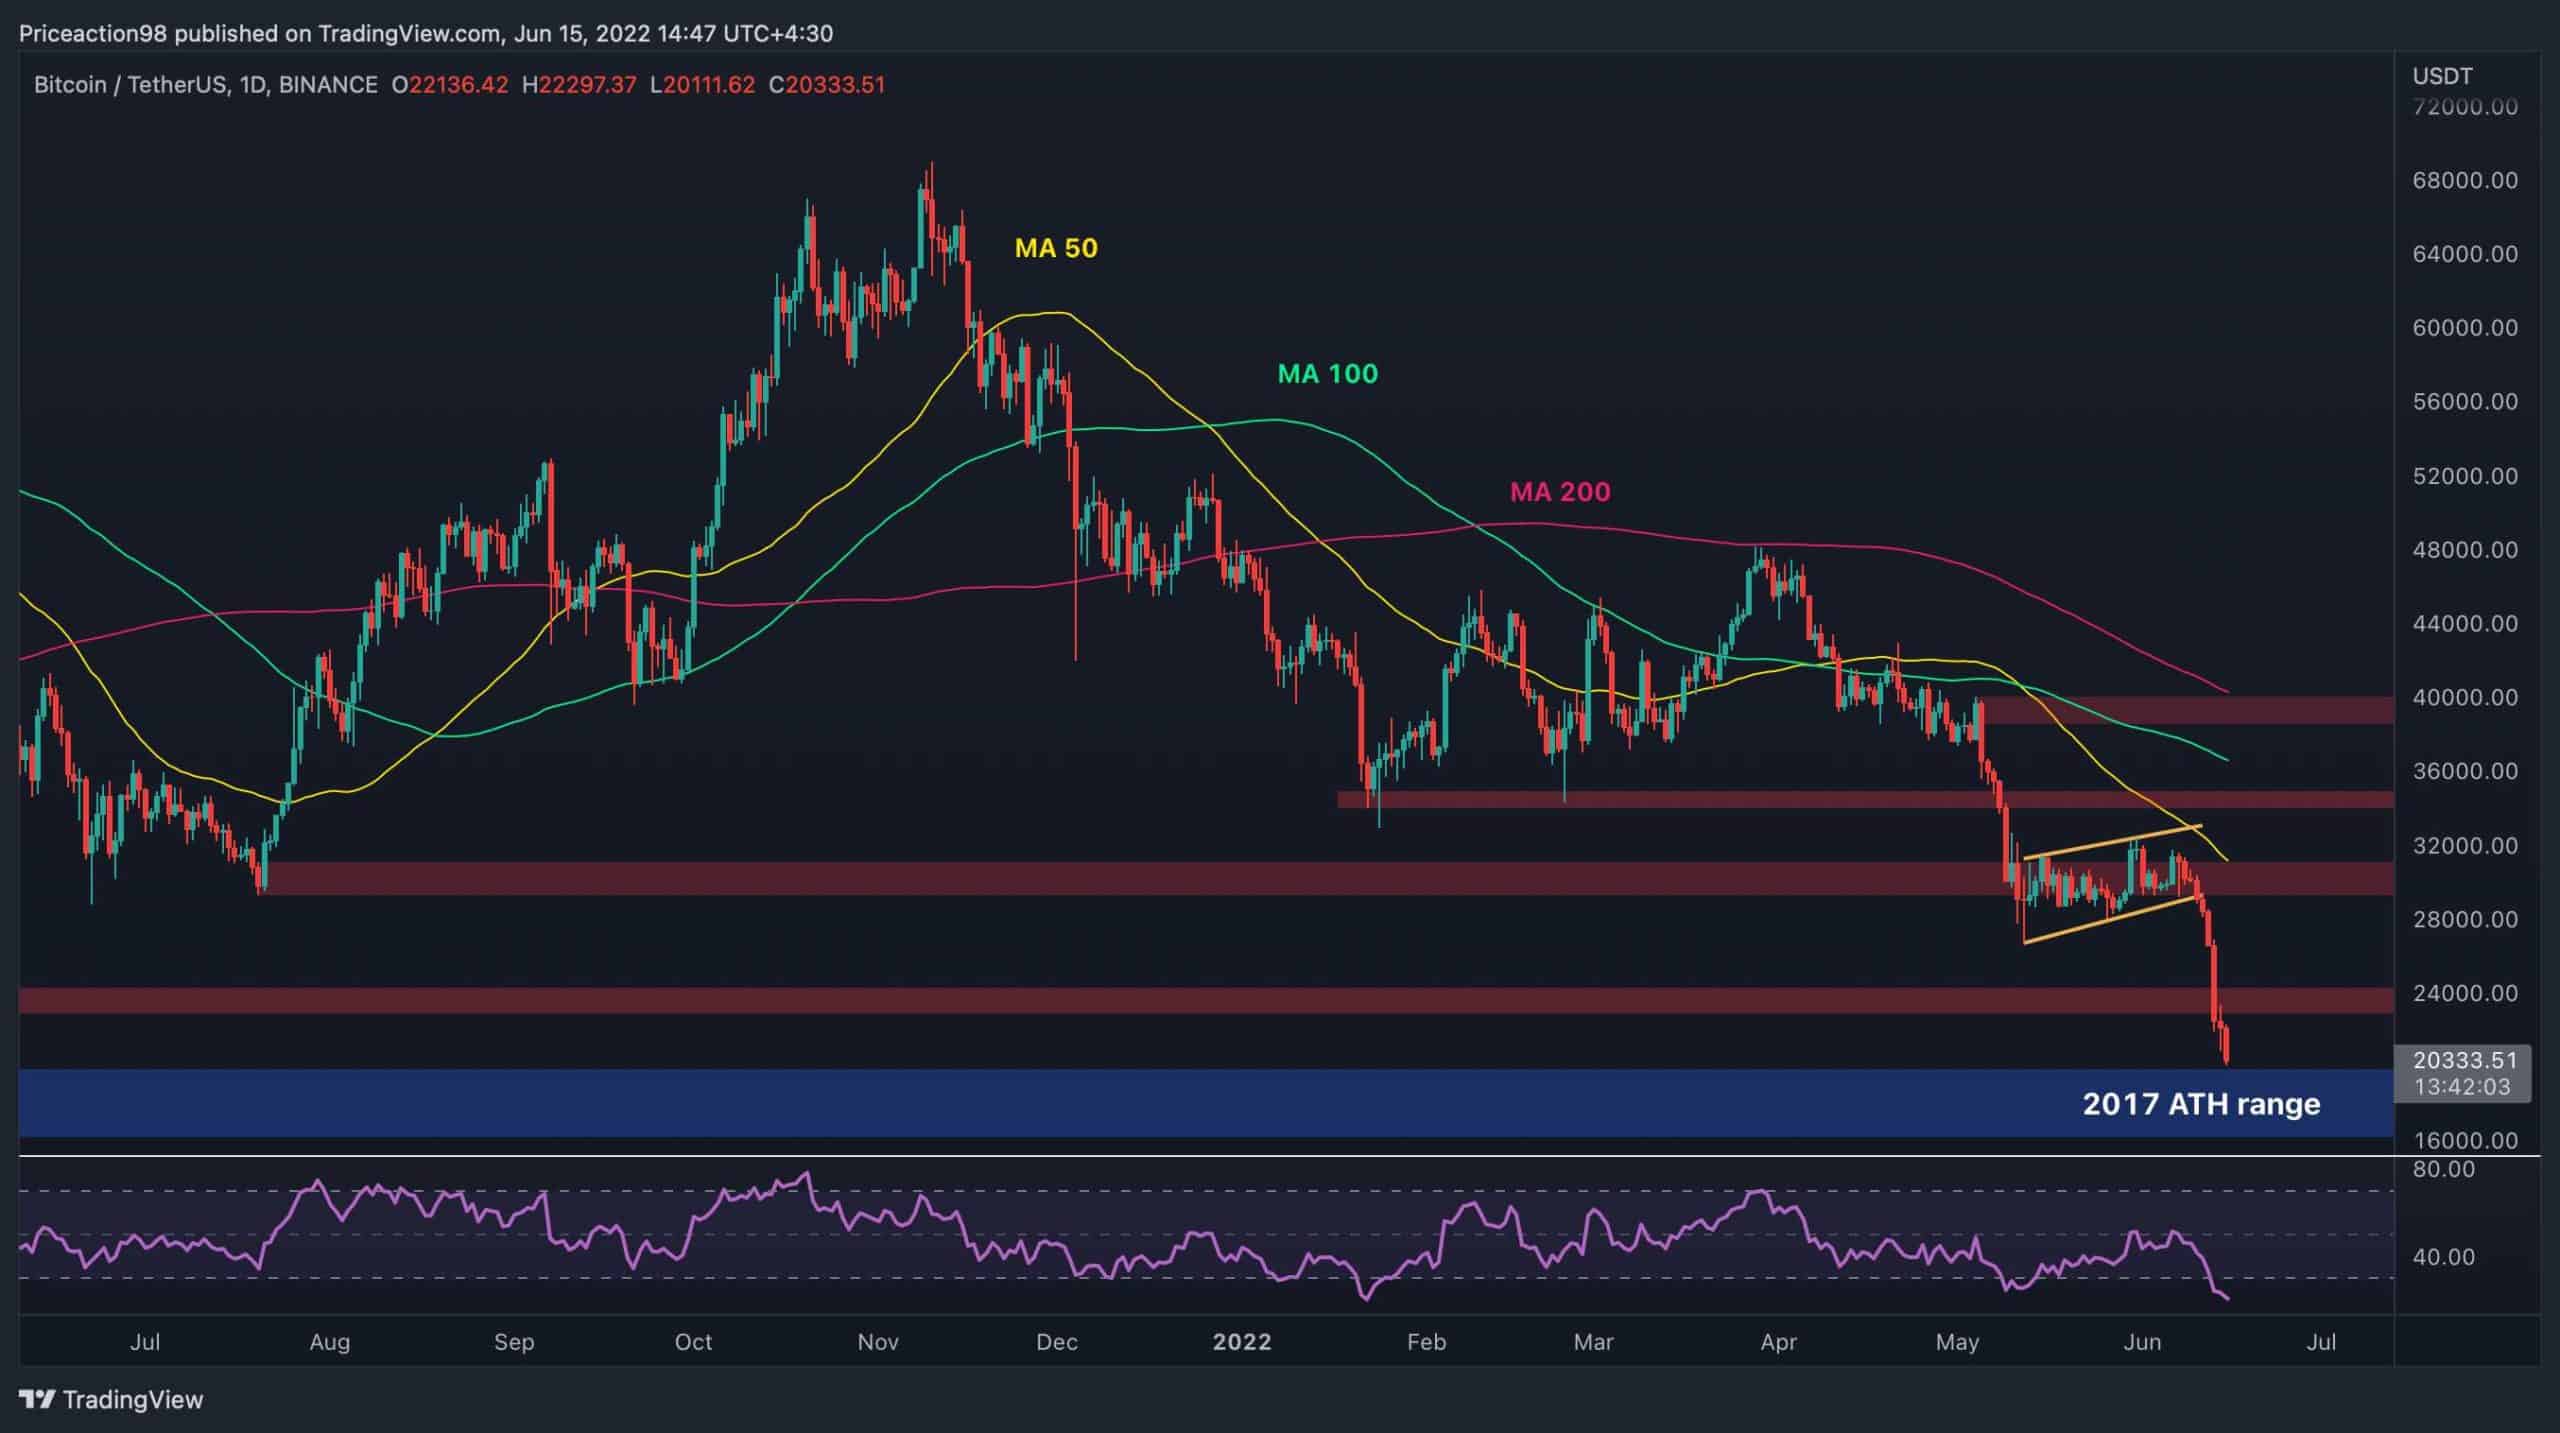
So, a bullish rebound or consolidation would likely occur at the mentioned support. However, it may be too soon to call a bear market bottom since the price would need to reclaim the $30K resistance and the 50-day moving average before any bullish reversal could be anticipated.

4-satni grafikon
On the 4-hour timeframe, it is evident that the price has broken below the $24K demand zone. Meanwhile, the price retested the broken $24K level to the downside before dropping further.
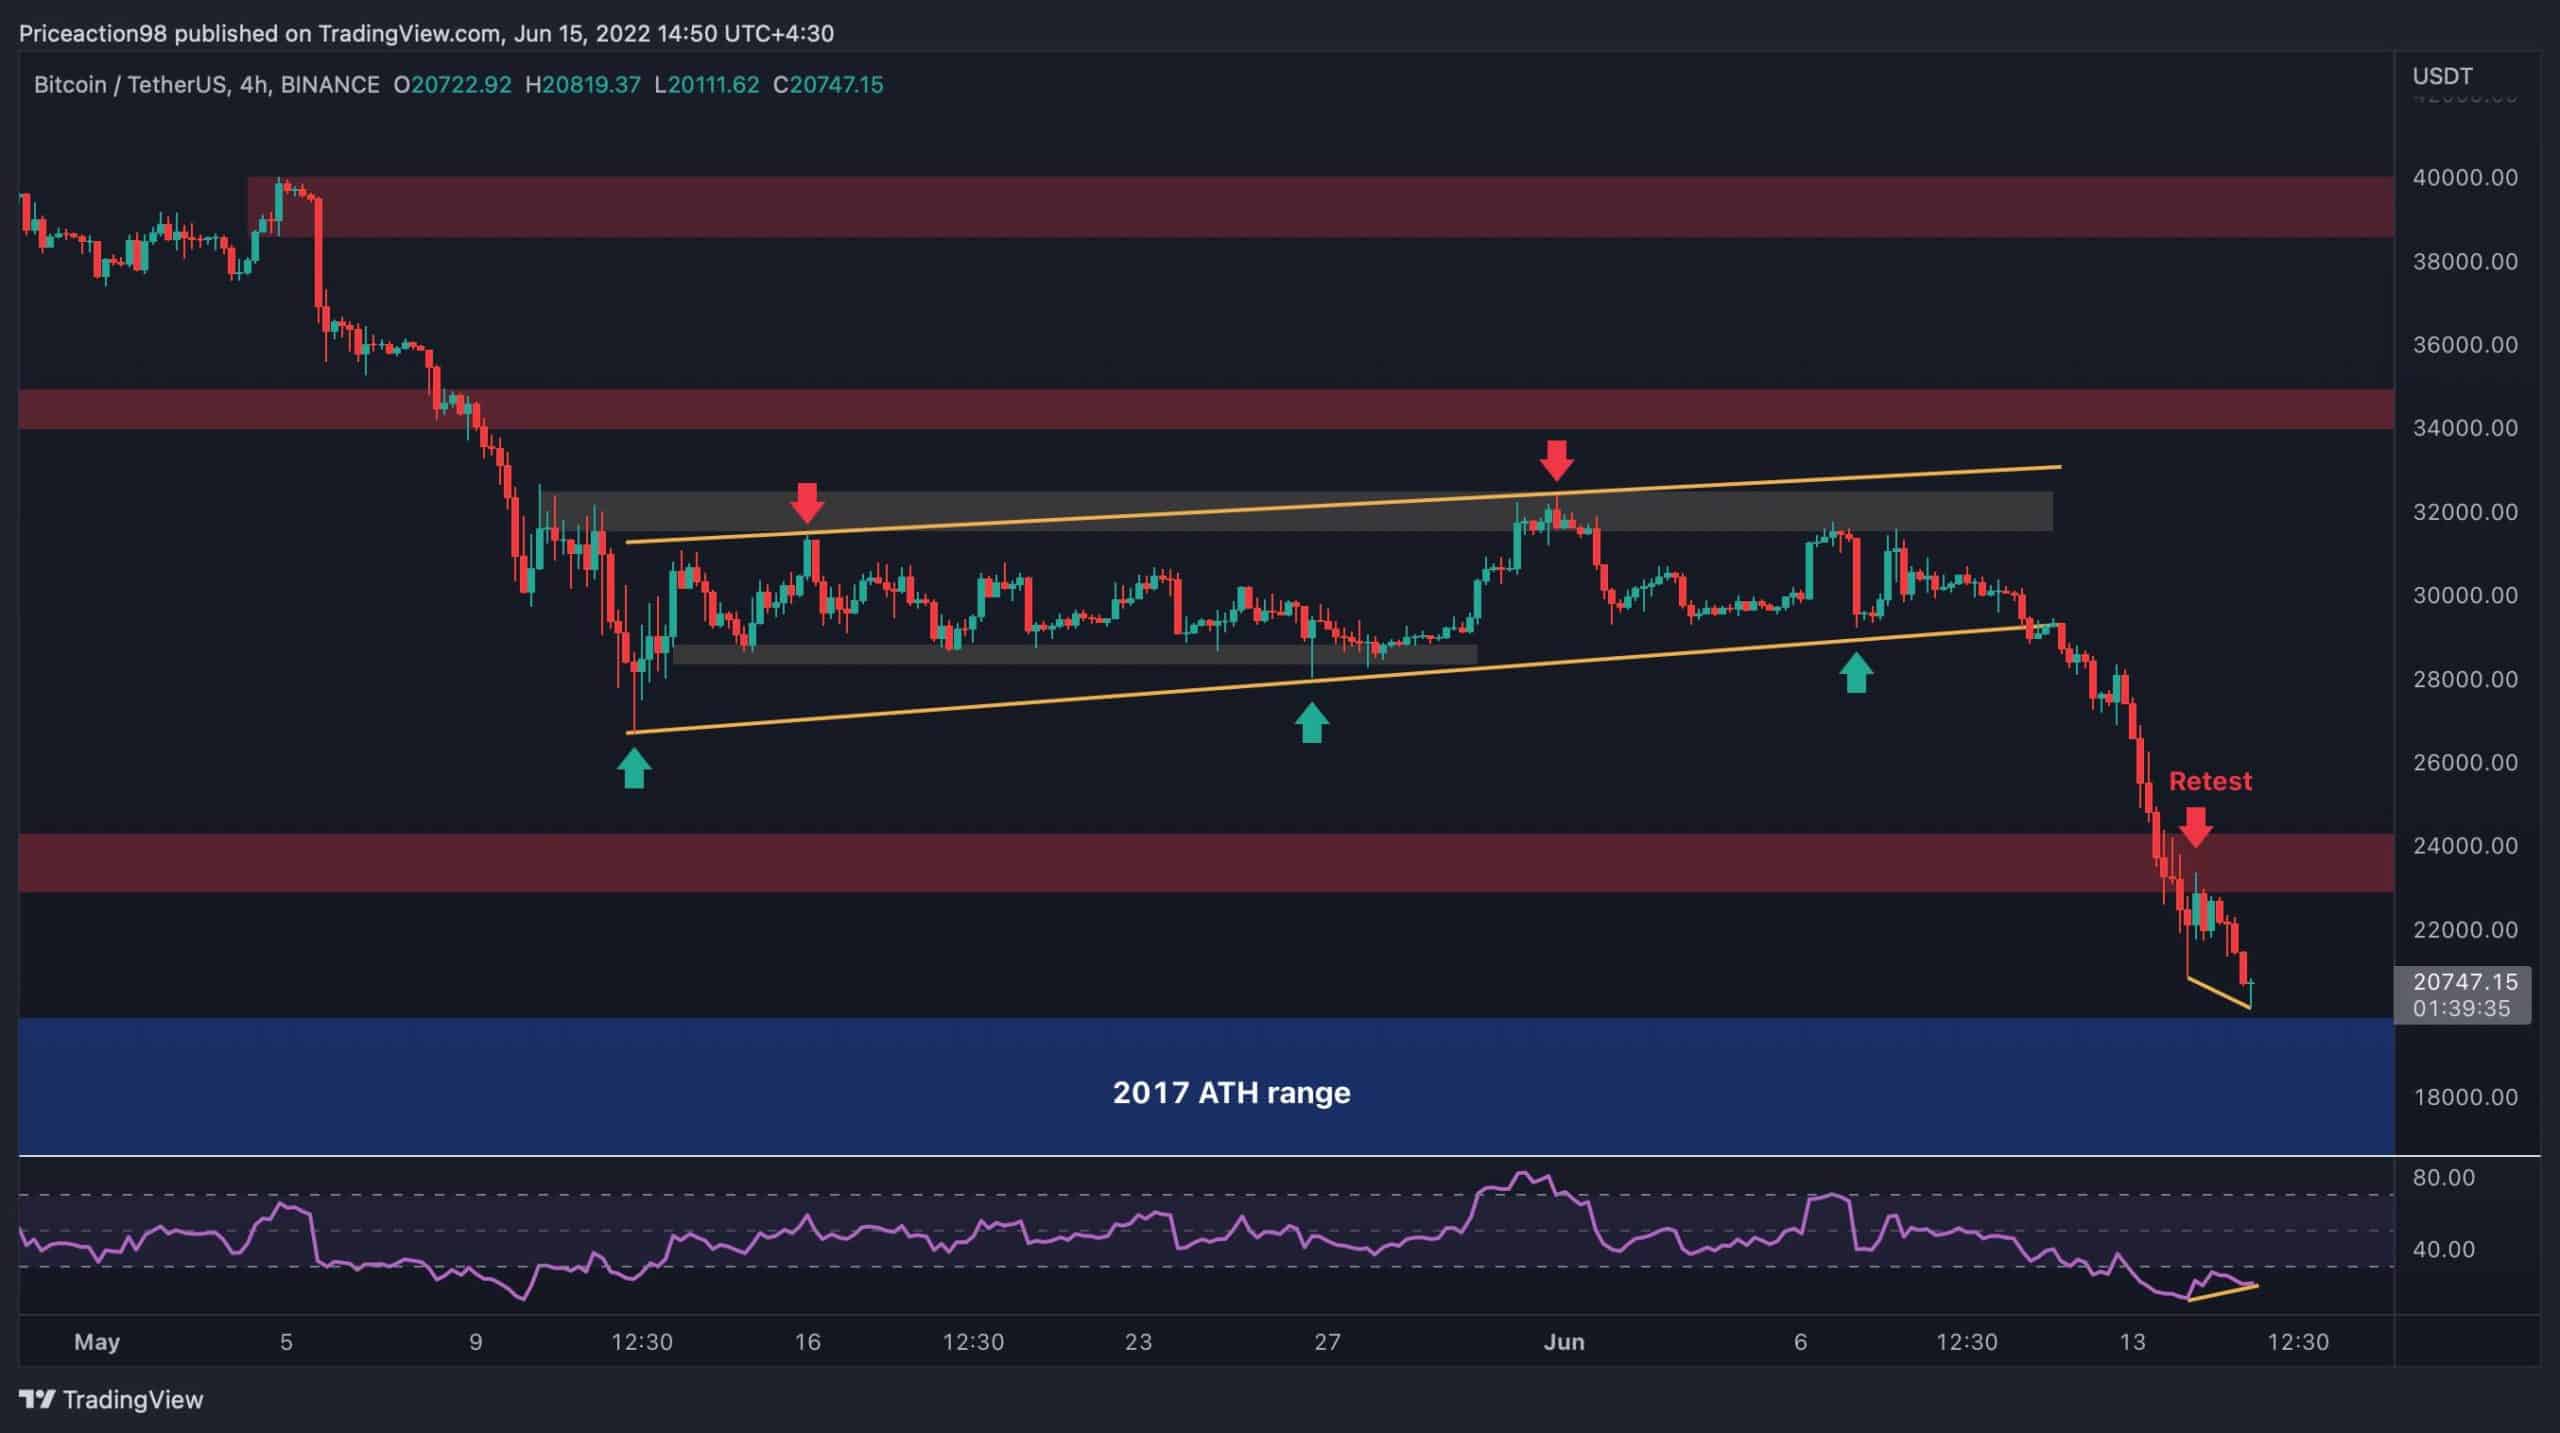
The RSI indicator is also oversold in this timeframe and may be forming a bullish divergence with the price, which points to a potential bullish rebound in the short term. The $24K level would now play as a resistance which could reject the price to the downside in case the price bounces from the $20K area. The lower timeframe price action should be observed closely over the next few days to determine if a bullish pullback or a further bearish continuation would be expected.
Analiza na lancu
By Edris
Bitcoin Capitalization Models
Bitcoin’s price has dropped rapidly towards the $20K region in the past few weeks, and the main question on everyone’s mind is where the bottom would likely form. Analyzing the past cycles could provide some valuable information.
This chart consists of the 200-day MA, Market Cap, Realized Cap, and Delta Cap. During the previous bear markets, there were cyclical bottoms between the Delta Cap and Realized Cap (you can study these metrics on the CryptoQuant website).
The Realized price is currently at $23K, and the Delta price is around $16K, so the market has already entered the potential bottom range. However, considering the current global macroeconomic and geopolitical situation and even previous Bitcoin cycles, a bottom formation could take up to a year or more.
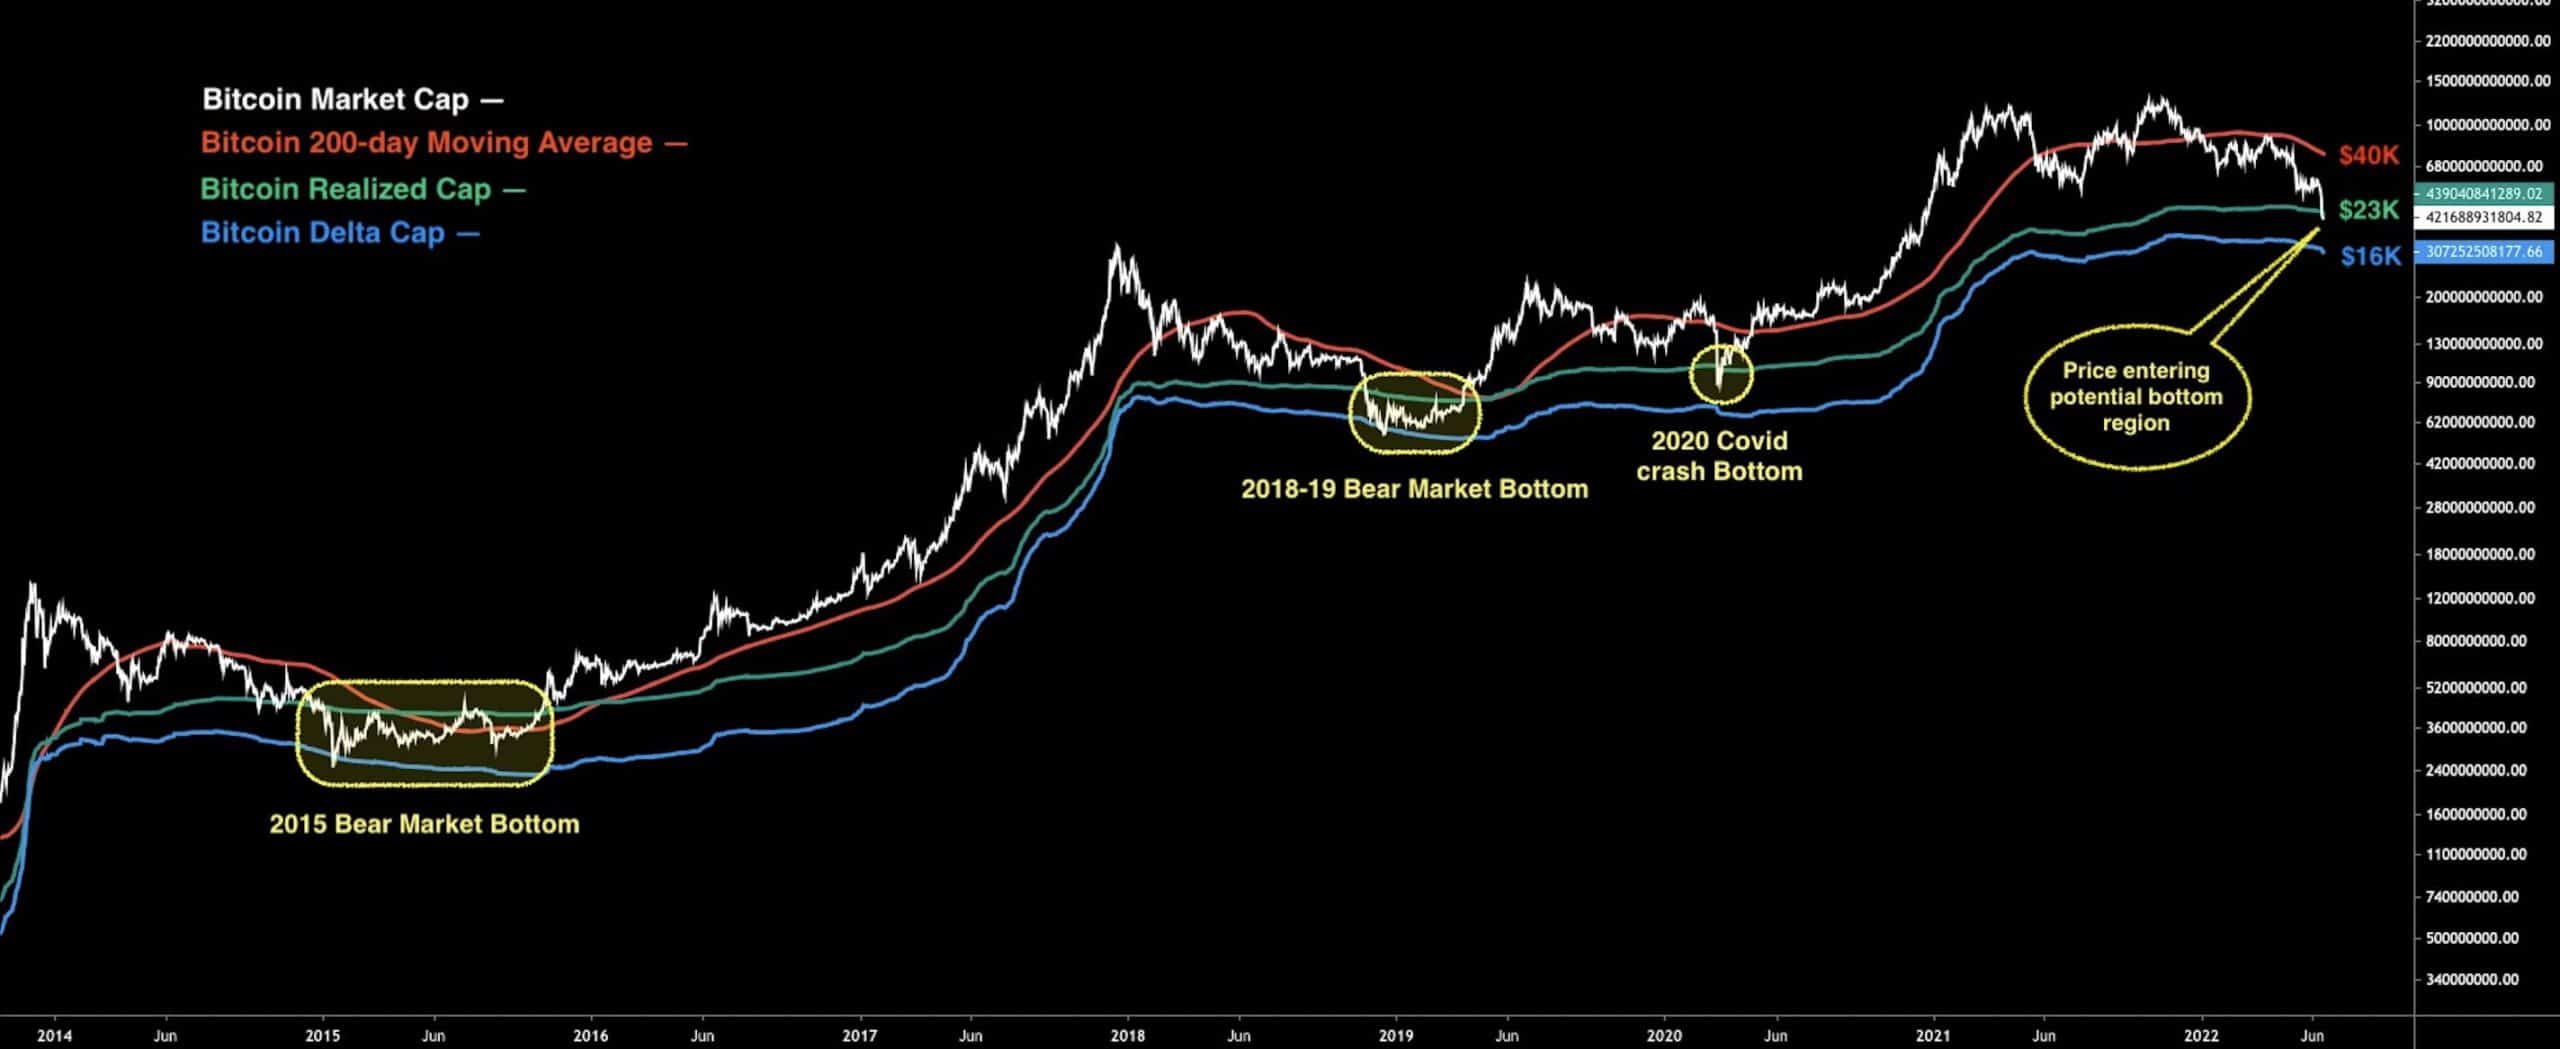
This bottom accumulation phase would end when the market rises above the Realized price again, and the bull market would begin when the price successfully breaks above the 200-day moving average (currently at $40K).
Binance besplatno $100 (ekskluzivno): Koristite ovu vezu da se registrujete i dobijete 100 $ besplatno i 10% popusta na Binance Futures prvi mjesec (uslovi).
PrimeXBT posebna ponuda: Koristite ovu vezu da se registrujete i unesete POTATO50 kod da dobijete do $7,000 na svoje depozite.
Izjava o odricanju odgovornosti: Podaci koji se nalaze na CryptoPotatu su podaci pisaca. Ne predstavlja mišljenja CryptoPotata o tome da li kupiti, prodati ili zadržati bilo kakva ulaganja. Savjetujemo vam da prije donošenja bilo kakvih odluka o investiranju provedete vlastita istraživanja. Korištene informacije koristite na vlastiti rizik. Pogledajte odricanje za dodatne informacije.
Cryptocurrency karte od TradingView.
Source: https://cryptopotato.com/bitcoin-price-analysis-if-20k-breaks-this-is-the-next-level-btc-is-likely-headed/