As we head into 2023, the markets are beginning to show some interesting movements, and Bitcoin is no exception. Its price is currently testing a key resistance zone, and the outcome would likely determine the short-term trend for the crypto market.
Tehnička analiza
by: Edris
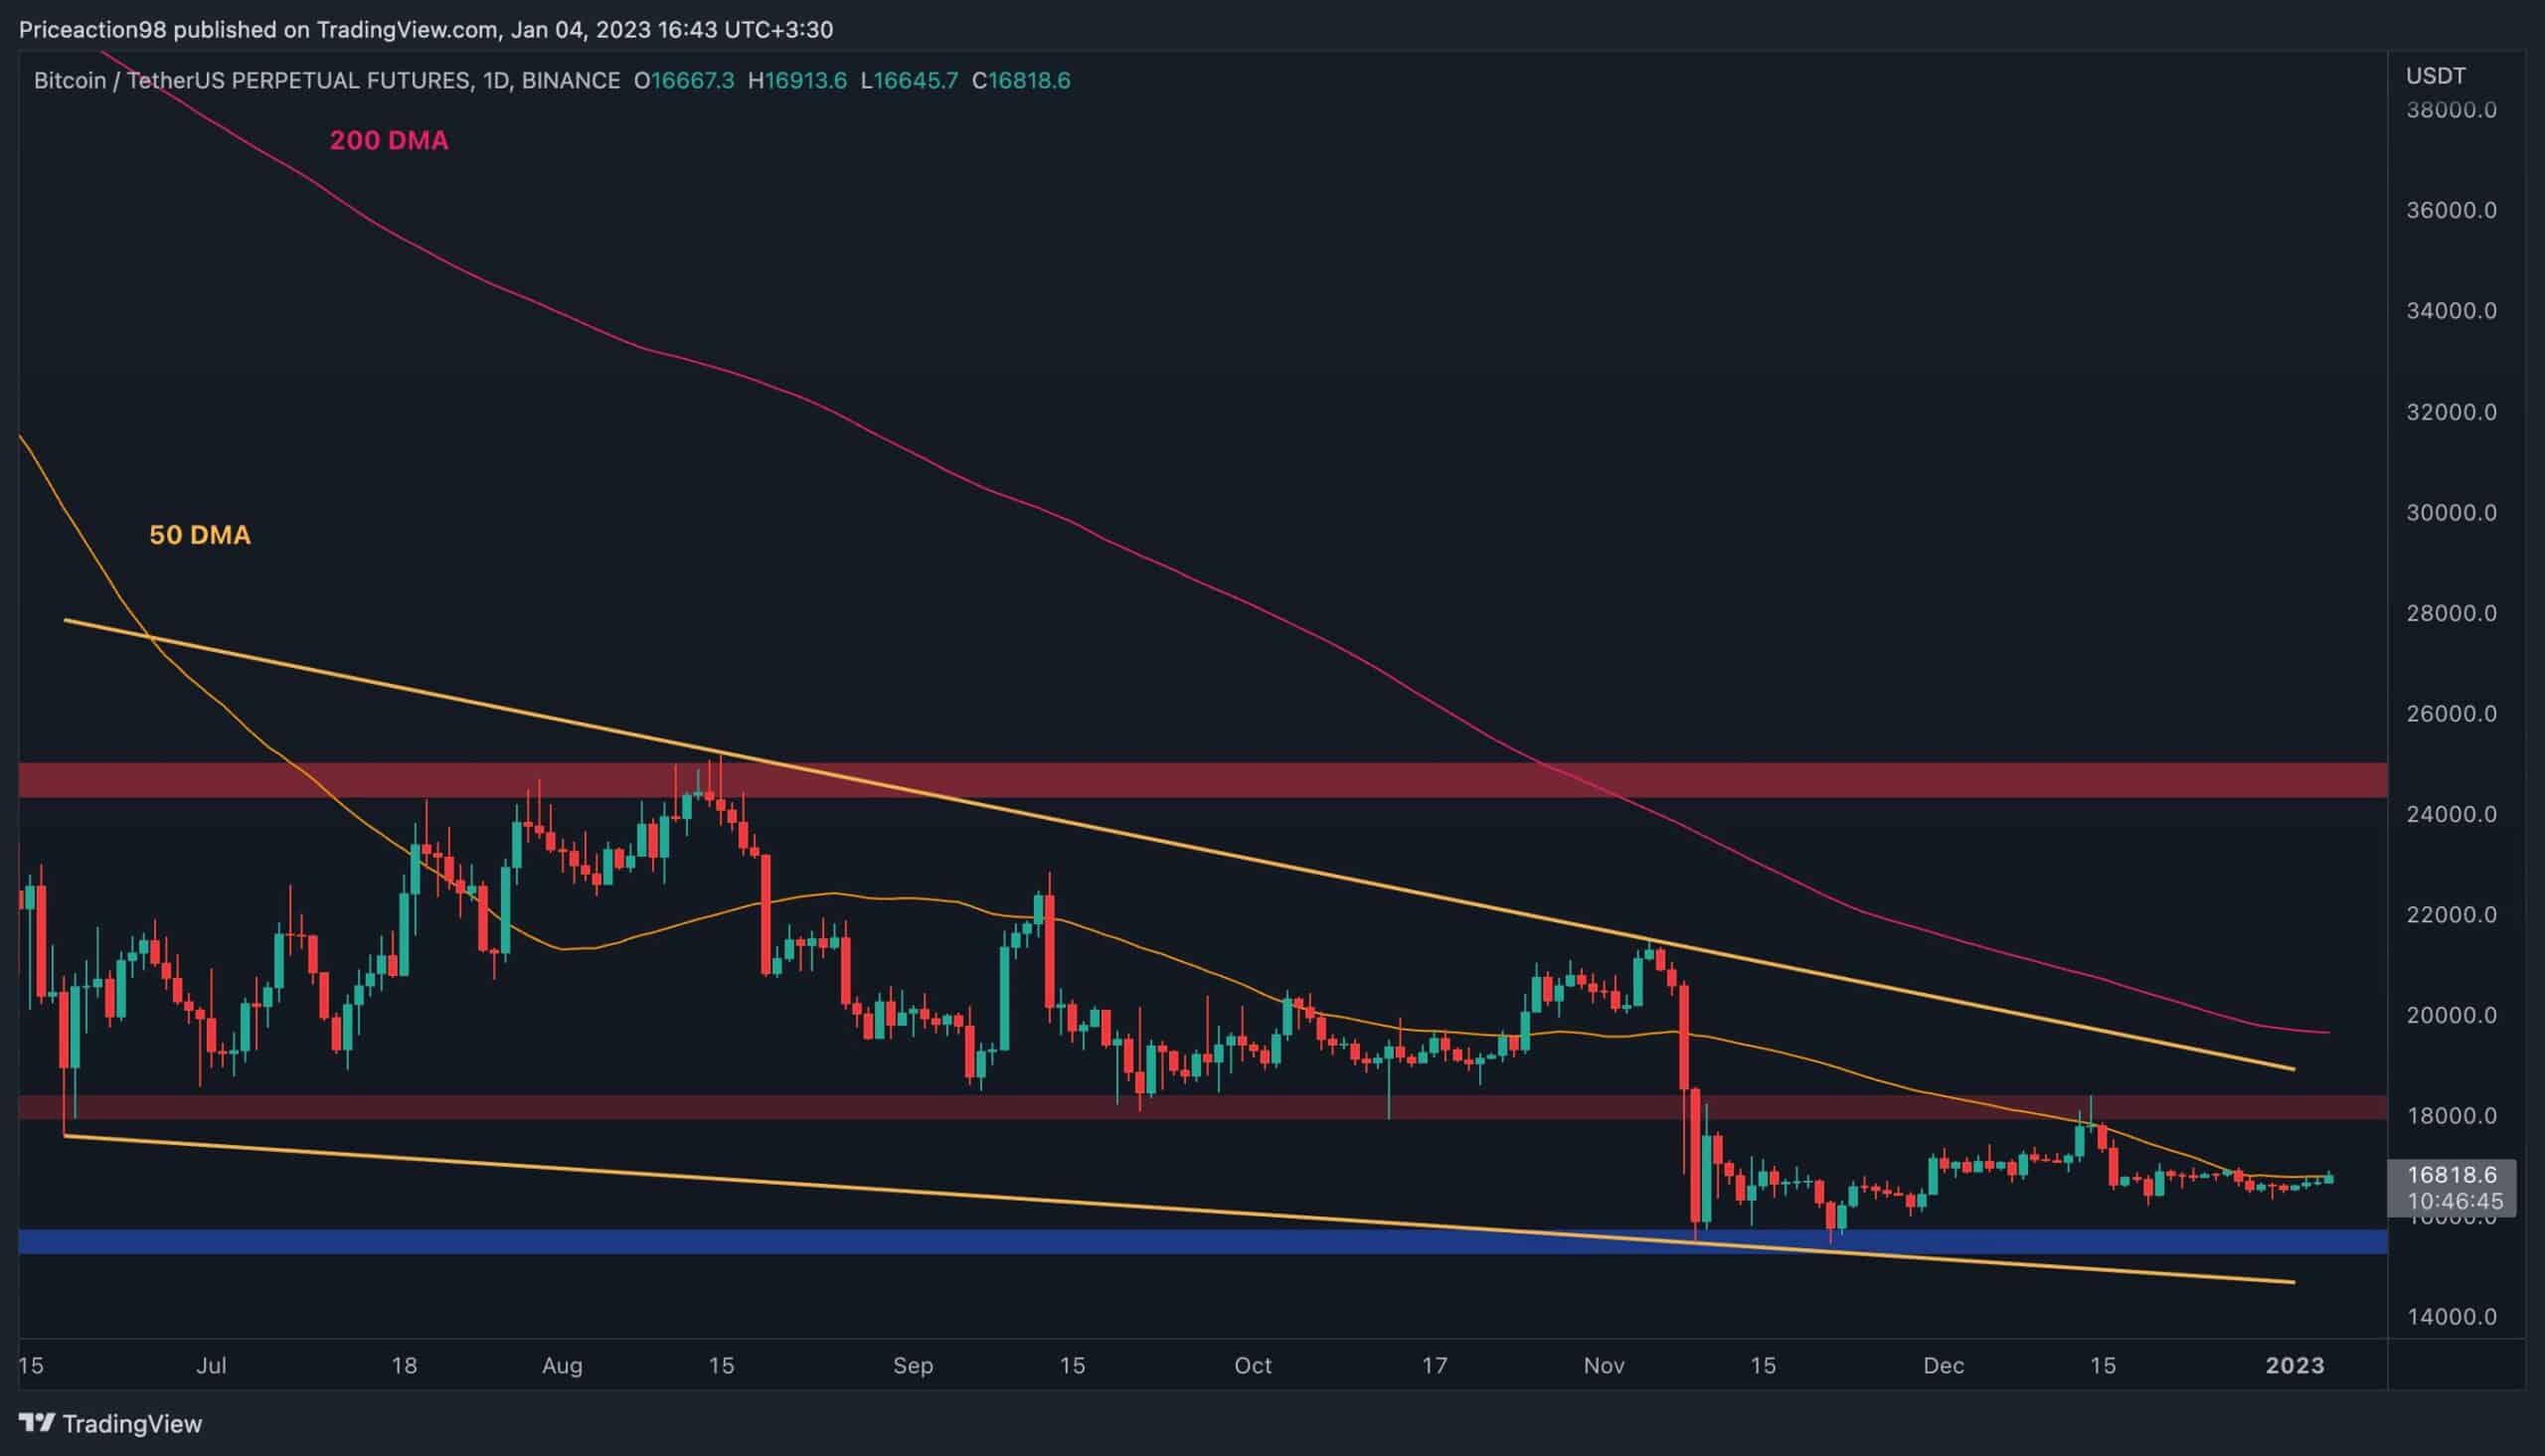
Dnevni grafikon
On the daily timeframe, the price seems to be closing in on finally disrupting the consolidation of the last few weeks, as the 50-day moving average is being tested once more around the $16,800 mark.
In case of a valid bullish breakout, there would be little resistance in the way, and a rise toward the $18K resistance level would be imminent. A breakout from this significant resistance level would likely lead to a breach above the large falling wedge pattern, which could lead to a bullish market structure in the mid-term.
However, as the price is yet to successfully climb above the 50-day moving average, there is still a considerable chance for rejection, which could result in a drop toward the $15K support level.

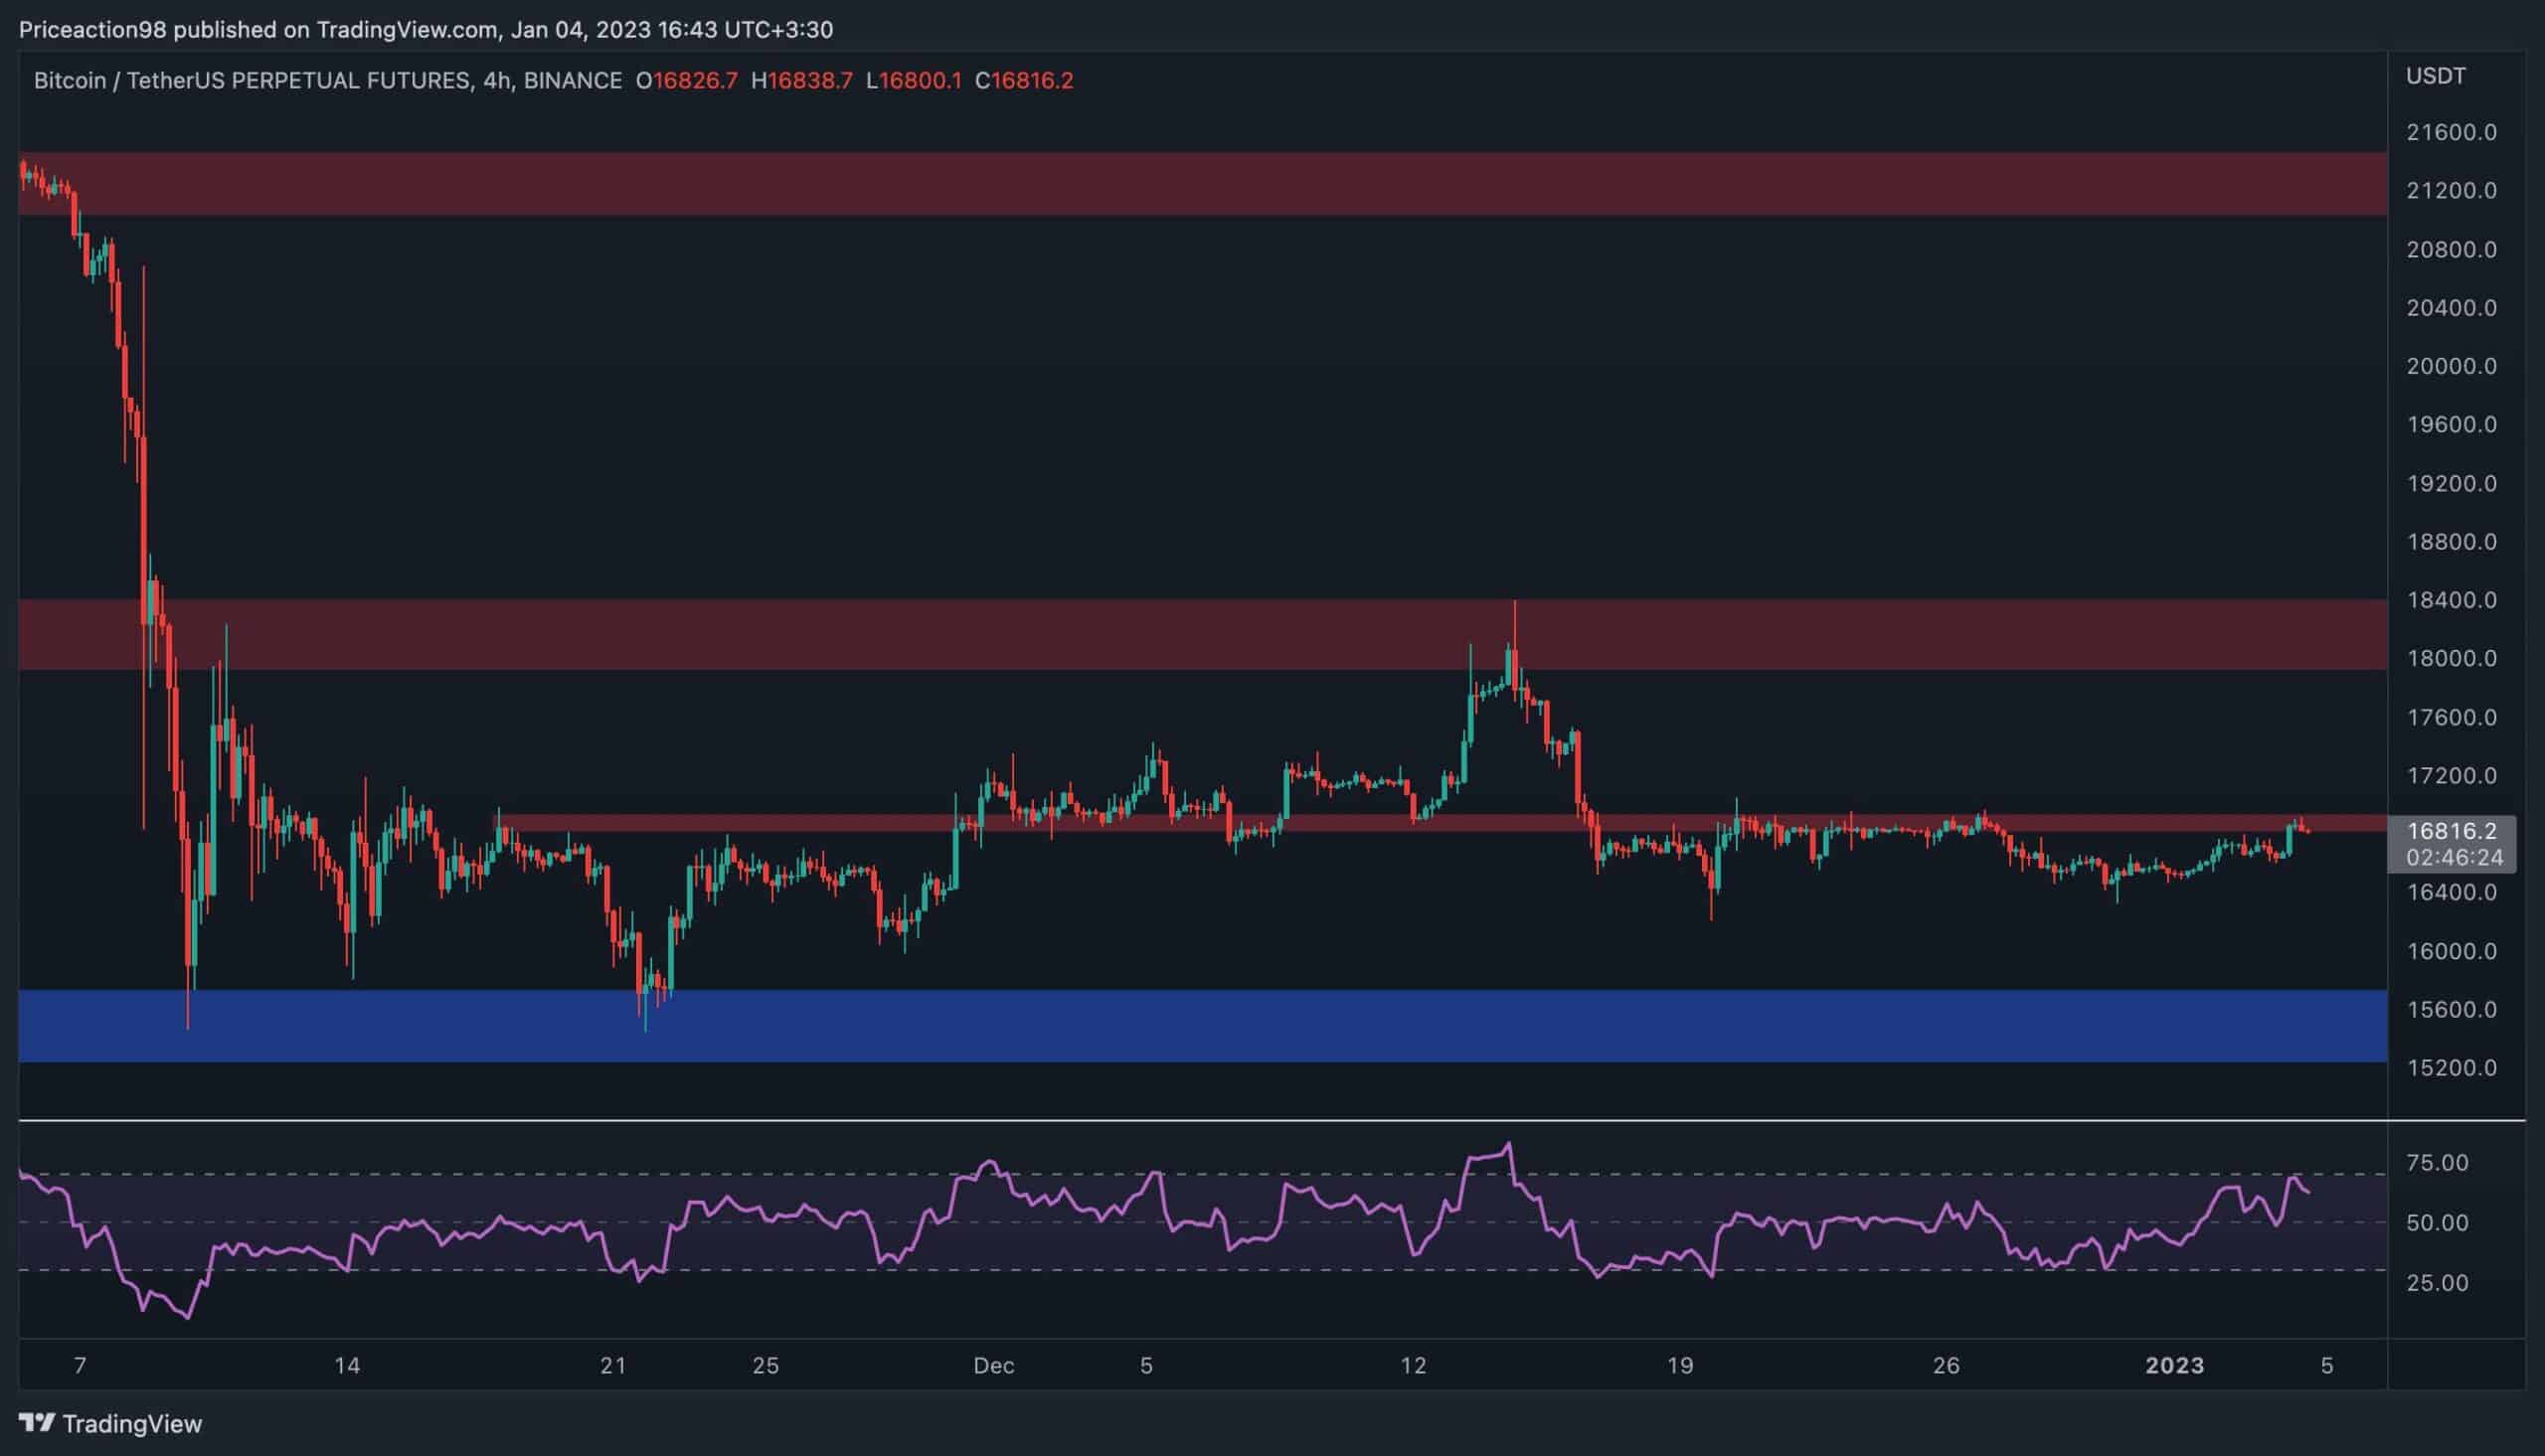
4-satni grafikon
Things appear trickier on the 4-hour timeframe, as the price action has been showing signs of rejection from the $16,800 level.
The RSI indicator should also be monitored closely as it is approaching the overbought zone of above 70%, a signal which could hint at rejection and a bearish reversal. In this case, the price could increase toward the $15,500 support area.
Still, it would be too soon to call it a bearish move, as the price is ranging near the resistance level and could showcase an impulsive break above it later in the day.
To summarize, the market is in a very crucial area, so the next few days, and potentially even hours, would likely decide the short-term trend based on the price’s reaction to the $16,800 area.
Onchain Analysis
By shayan
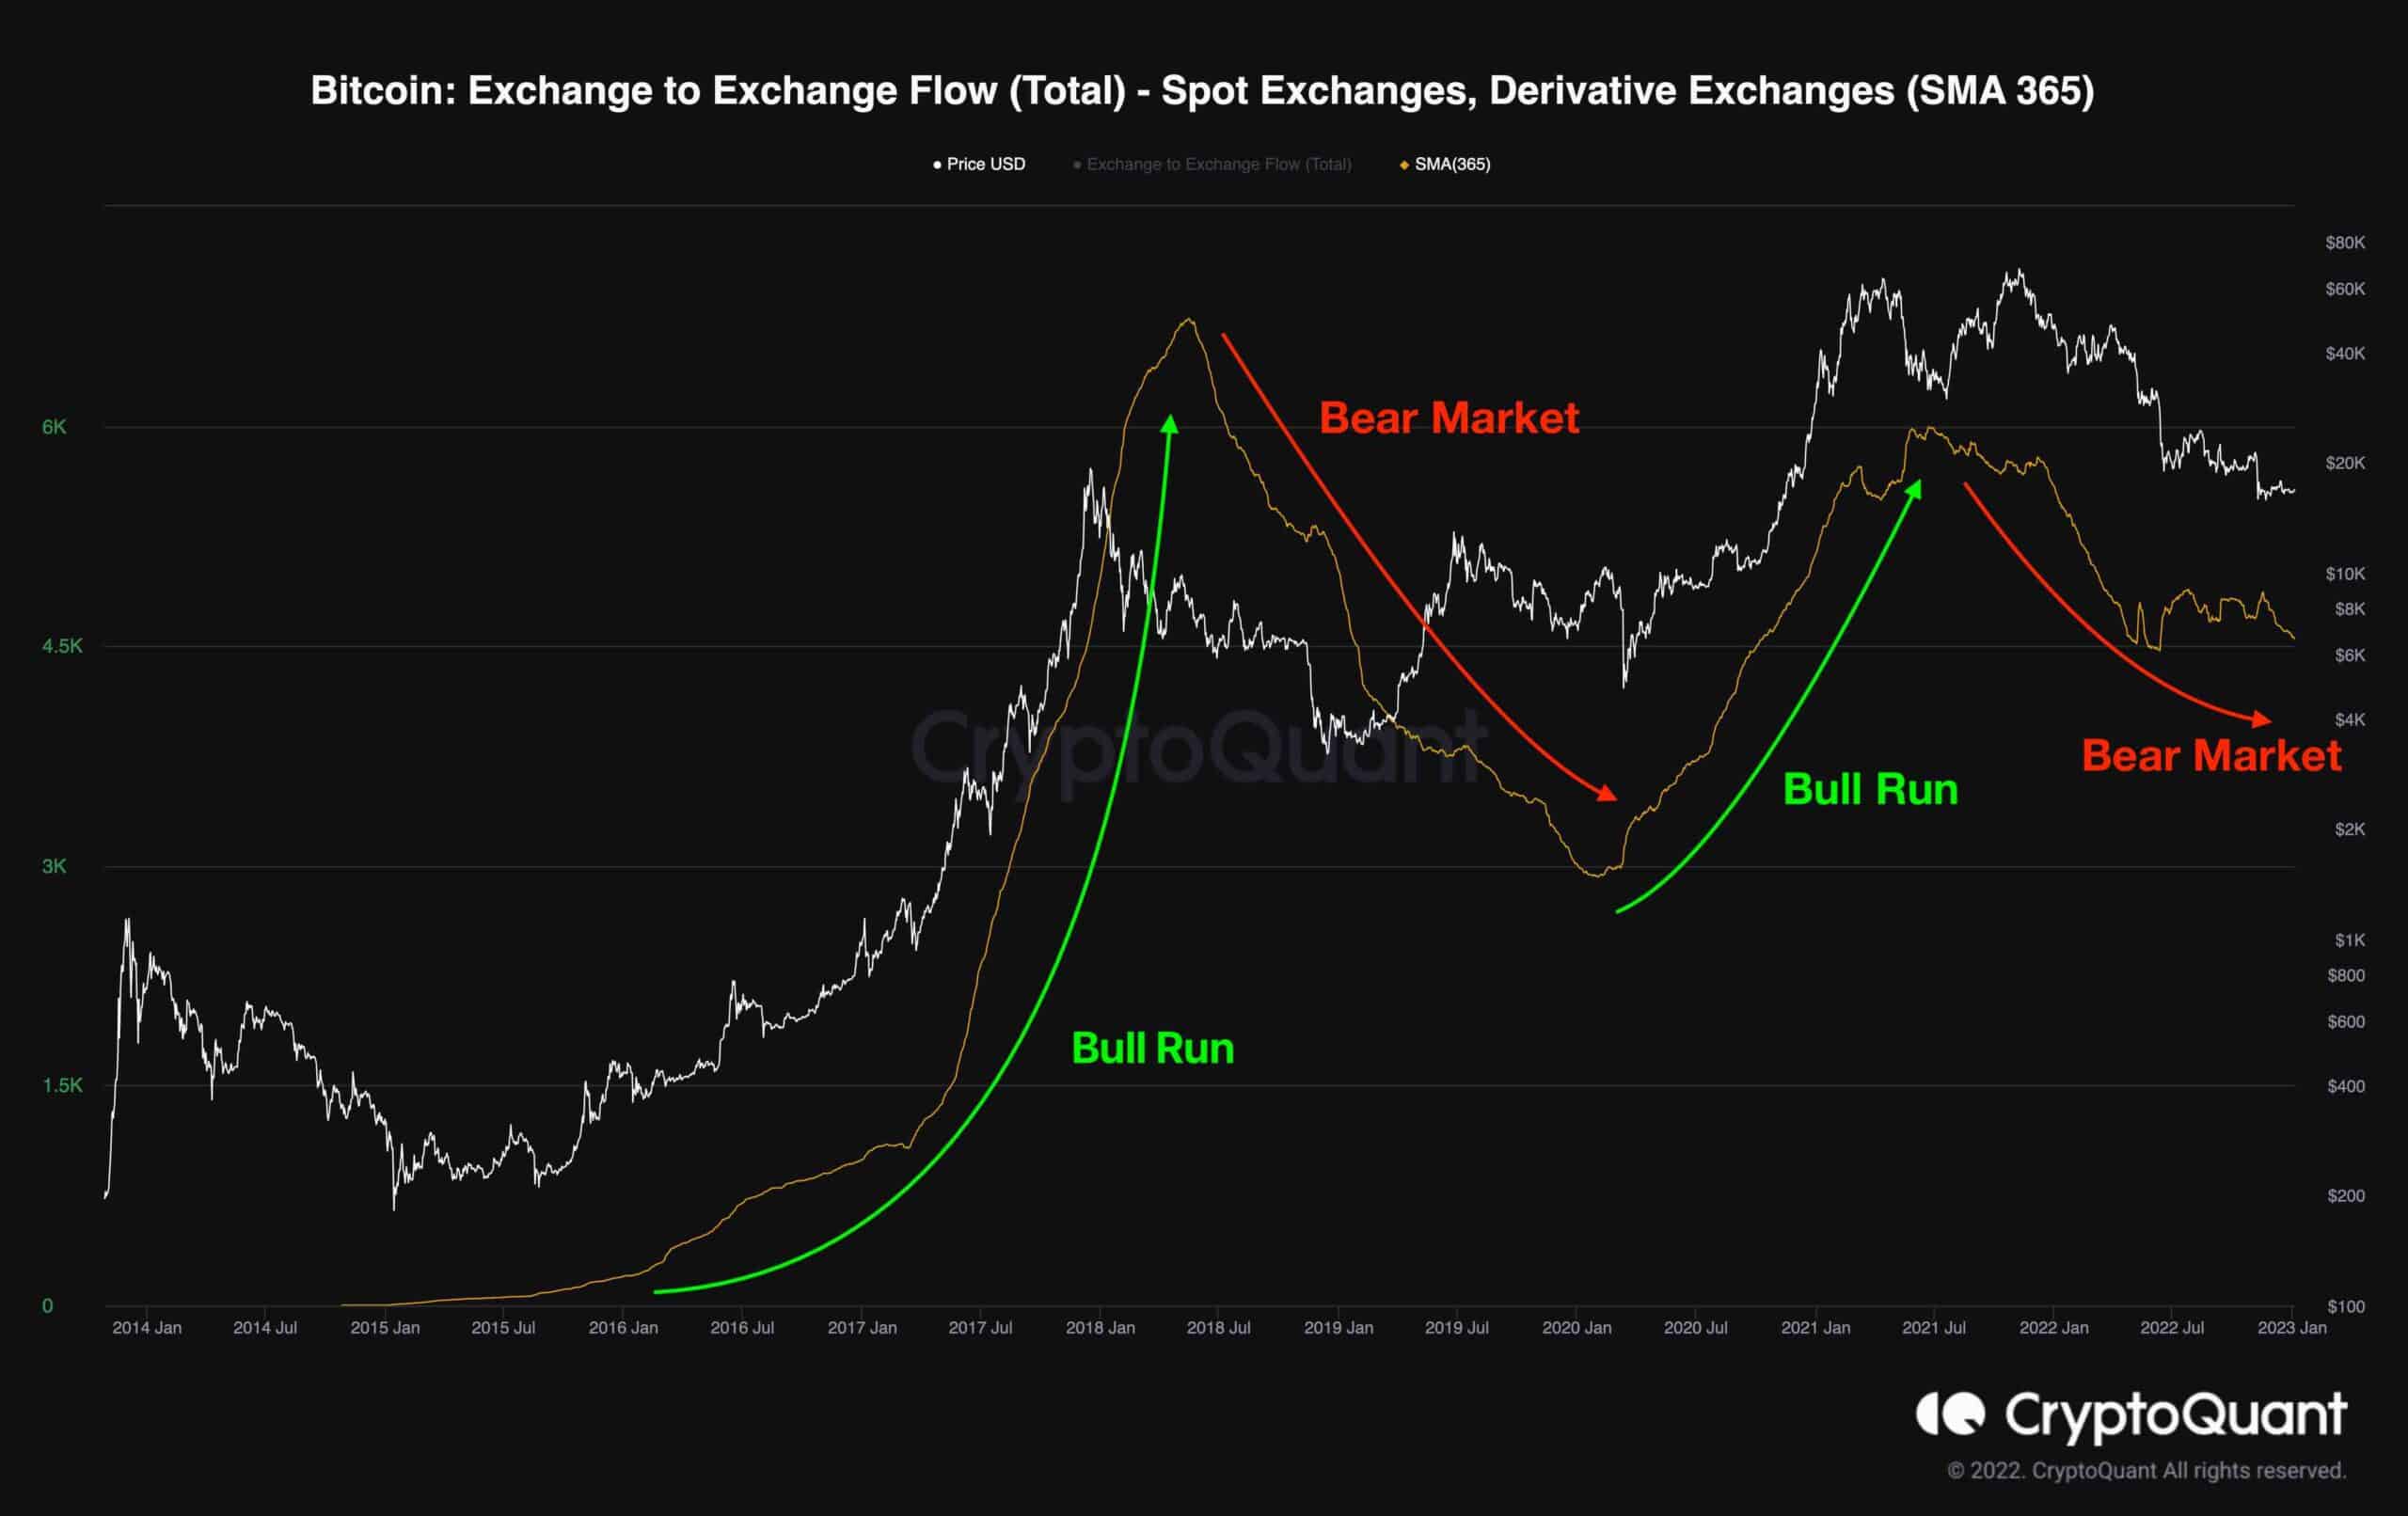
The following chart consists of the Exchange to Exchange Flow (Spot to Derivatives Exchanges) metric alongside Bitcoin’s price. Evidently, derivatives markets are closely correlated with both the bullish and bearish stages of the market.
An increase in the metric indicates higher activity in the derivatives markets. Typically, participants use derivatives exchanges to manage their risk and exposure to the market, and a few use the leverage option to expand their profits.
Based on the graph, the 365-day moving average of the metric surged during the Bitcoin bull markets while, conversely, it declined during the bear markets – showing a high correlation.
Currently, the metric is plummeting with significant momentum. Therefore, it might be too early for Bitcoin to start a bull market, as the metric still has room to decline.
Binance besplatno $100 (ekskluzivno): Koristite ovu vezu da se registrujete i dobijete 100 $ besplatno i 10% popusta na Binance Futures prvi mjesec (uslovi).
PrimeXBT posebna ponuda: Koristite ovu vezu da se registrujete i unesete POTATO50 kod da dobijete do $7,000 na svoje depozite.
Izjava o odricanju odgovornosti: Podaci koji se nalaze na CryptoPotatu su podaci pisaca. Ne predstavlja mišljenja CryptoPotata o tome da li kupiti, prodati ili zadržati bilo kakva ulaganja. Savjetujemo vam da prije donošenja bilo kakvih odluka o investiranju provedete vlastita istraživanja. Korištene informacije koristite na vlastiti rizik. Pogledajte odricanje za dodatne informacije.
Cryptocurrency karte od TradingView.
Source: https://cryptopotato.com/btc-inching-toward-17k-is-a-breakout-imminent-bitcoin-price-analysis/