The Bitcoin price analysis for today indicates that the market outlook has turned positive, with prices showing signs of a recovery following the mid-November dip. Bitcoin led the other cryptocurrencies in the bull market, with prices rising sharply to the current level of $16,722.83. Bitcoin is up by 0.83 percent and has been fluctuating around the $16,500 level in the last 24 hours.
Bitcoin’s trading volume has surged in recent days, reaching a peak of over $11.8 billion in the last 24 hours. Since there is no sign of volatility and the BTC price predictions favor a new decline, Bitcoin starts 2023 with a whimper. The first week of 2023 gets off to a lackluster start as traders and volatility both stay away. BTC price action is still stuck in a constrained range after remaining stationary over the holiday season between Christmas and New Year’s.
Although 2022 was arguably a classic bear market year for Bitcoin, with annual losses of almost 65%, few people are currently actively forecasting a recovery. For the typical hodler, who is keeping an eye out for macro triggers provided by the US Federal Reserve and economic policy effects on dollar strength, the situation is complex.
Bitcoin price analysis on a daily chart: Is a bearish reversal likely?
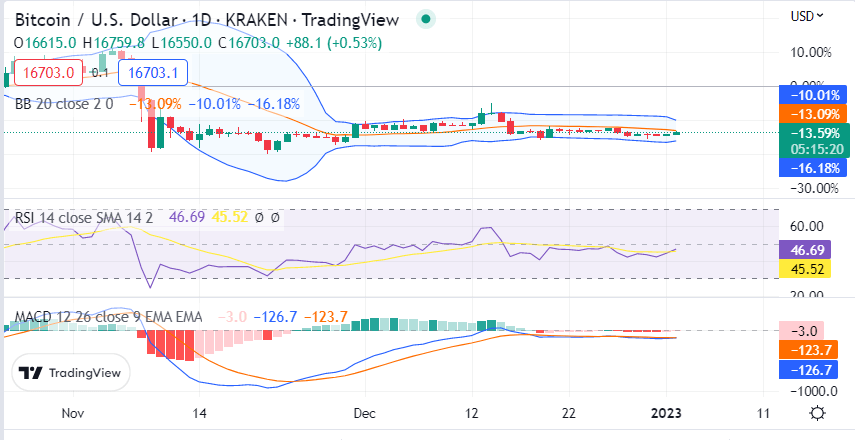
Bitcoin price analysis on a daily chart shows the $18,000 resistance level displays concordance with Bitcoin’s former pivotal point. According to Bitcoin price analysis, pivotal points are critical in acting as a buffer for the price based on the inclination of the trajectory.
A failure to surpass the preceding key pivot in an ascendant charge is a definite bearish indicator. To confirm the sell-off, if Bitcoin follows its current bearish pattern, a break and close beneath the SMA50, at $16,215, could be the confirmation point traders look for, which means that lower lows exist ahead.
Other technical signs of Bitcoin weakness include the Relative Strength Index trending below the 50 levels. The Moving Average Convergence Divergence (MACD) oscillator appears to be slipping into bearish territory, supporting a downward trajectory. This trend will be watched carefully by buyers who currently perceive a likely shift in the market dynamic. In the event of more extremes, the presently supported levels of $15,426 and $ 14180 could become the next major bear target levels.

A break below the SMA50 and these lower supports could signal the end of Bitcoin’s selling pressure, with some speculators predicting the next key downside target to be around $13,750. Further gains will be impossible in the near future, giving rise to the possibility of bottom fishing in the days ahead. Moreover, the Moving Average Convergence Divergence (MACD) 12-day EMA is presently close to coming under the 26-day EMA, which could further confirm a bearish outlook.
Bitcoin price analysis on a 4-hour chart: Bullish momentum intact
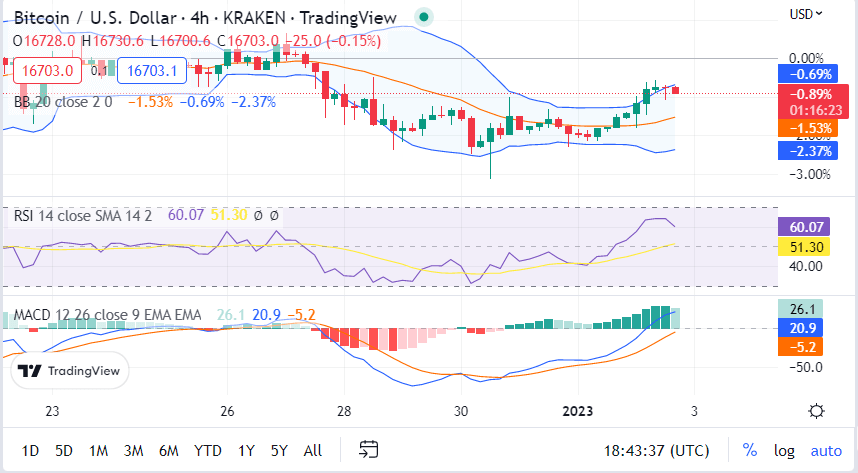
The 4-hour chart shows bullish momentum still in place, with the 12-day EMA trending higher and further above the 26-day EMA. The Relative Strength Index (RSI) of 60 indicates a bullish market sentiment, while the MACD line is currently rising. If the 12-day EMA continues to stay above the 26-day EMA, the volatile market could possibly depict a further positive response.

However, any sudden dips could create an opportunity for profit-taking. Thus, the Fib retracements indicate a support range from $16,000 to $14,000, and if the bulls manage to push the price even further, it could potentially drive Bitcoin toward the $20,000 to $24,000 zone.
Zaključak analize cijena bitcoina
Overall, the Bitcoin price analysis for today shows that all the indicators seem to be pointing towards bullish momentum, suggesting that Bitcoin could be in the midst of a rally. To ensure that the current positive sentiment remains intact and to maximize the potential for further gains, strong buying pressure is essential. However, if the bullish sentiment remains unrelenting, profit-taking activity could be triggered and lead to a sudden drop in price.
Izvor: https://www.cryptopolitan.com/bitcoin-price-analysis-2023-01-02/
