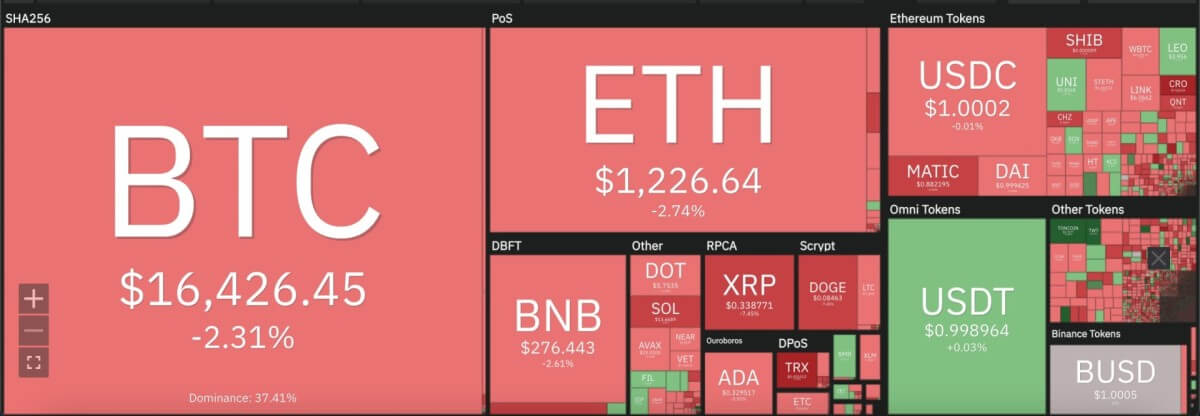
Bitcoin price analysis shows price decline deepened a further 3 percent over today’s trade, as price went down to $16,200. BTC has been in consistent decline since November 6, and a further 4 percent decline could push price to test the $16,000 support mark. The intraday Bitcoin volume went down to $24.9 billion, recording a 32 percent decline. Altogether over the current decline, Bitcoin’s market value has dropped around 76 percent from a high of $68,789. At current discounted price on offer, buyers could flock into the market and provide a relief rally up to the $18,000 mark at the start of next week.
The larger cryptocurrency market largely stayed in decline, as Ethereum shipped another 3 percent to move down to $1,200. talasanje dropped 8 percent to move down to $0.33, while Cardano dropped down to $0.33 with a 4 percent decrement. Meanwhile, Dogecoin declined 7 percent to $0.06, with Solana shed 8 percent to move as low as $13.67 and Polkadot recorded a minor decrement to move down to $5.75.

Bitcoin price analysis: 24-hour RSI moves into severe under valued zone
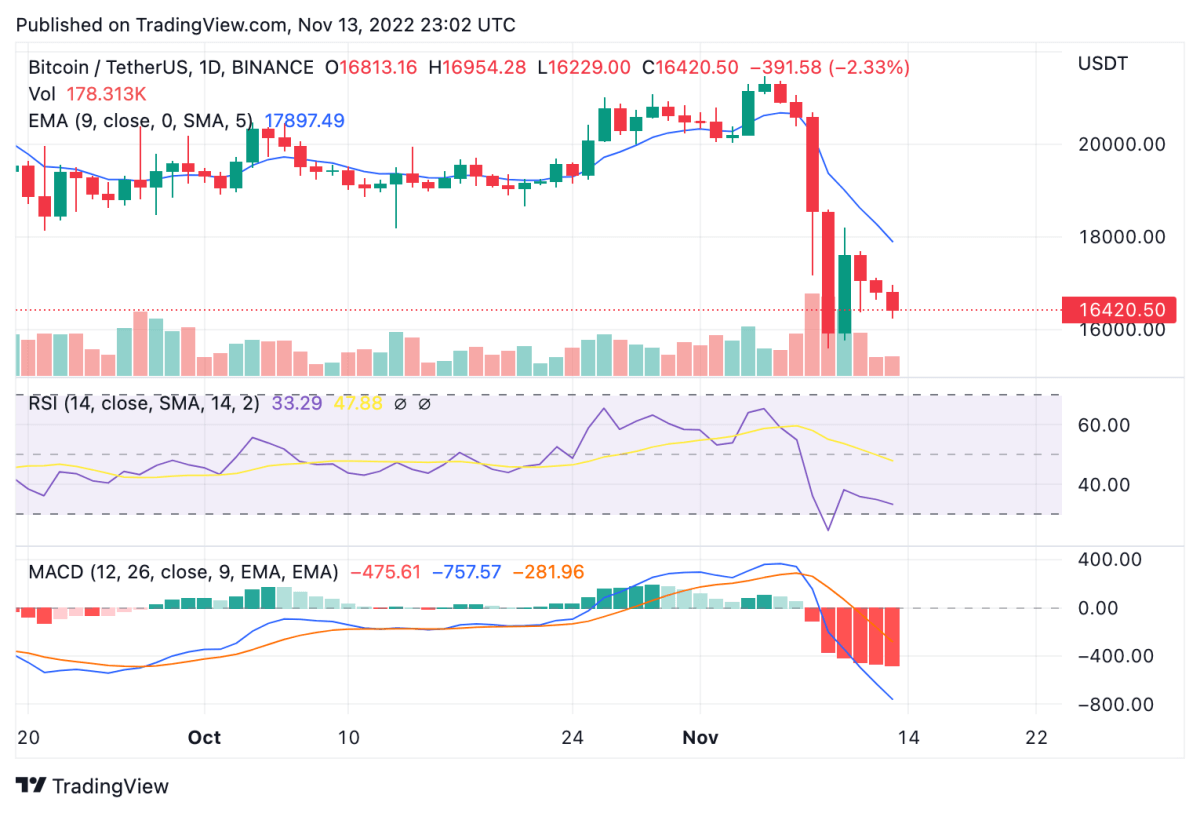
On the 24-hour candlestick chart for BItcoin price analysis, price can be seen recording consecutive days of decline since November 6, forming a downtrending pattern over the past 3 days. With this downtrend in place, the market for BTC provides an opportunity for buyers to formulate upward momentum towards the $18,000 mark. In this respect, the 24-hour relative strength index (RSI) shows a severely undervalued market status for BTC at 33.24. A bullish divergence in the RSI curve could indicate buying activity around the $16,000 mark.

Price has dipped severely below the 9 and 21-day moving averages over the past 3 days, including a move below the crucial 50-day exponential moving average at $17,894. Meanwhile, the moving average convergence divergence (MACD) curve can be seen forming a deep bearish divergence over the current price action. Volatility in the market currently is medium, while resistance levels sit at $18,200 and $20,000 whereas support can be found at $16,000.
Odricanje od odgovornosti. Navedene informacije nisu savjet za trgovanje. Cryptopolitan.com ne snosi odgovornost za bilo kakva ulaganja temeljena na informacijama navedenim na ovoj stranici. Prije donošenja bilo kakvih investicijskih odluka toplo preporučujemo neovisno istraživanje i / ili savjetovanje s kvalificiranim stručnjakom.
Izvor: https://www.cryptopolitan.com/bitcoin-price-analysis-2022-11-13/
